Webinar attendance ranges from about 40% (Wistia, 2026) to 60% (ON24, 2026) of registrants across reports covering different periods. These webinar statistics show why I plan around the platform and audience behind each benchmark.
59 Webinar Statistics for 2026: Attendance to ROI
 Written by Editorial Staff
Key Takeaways
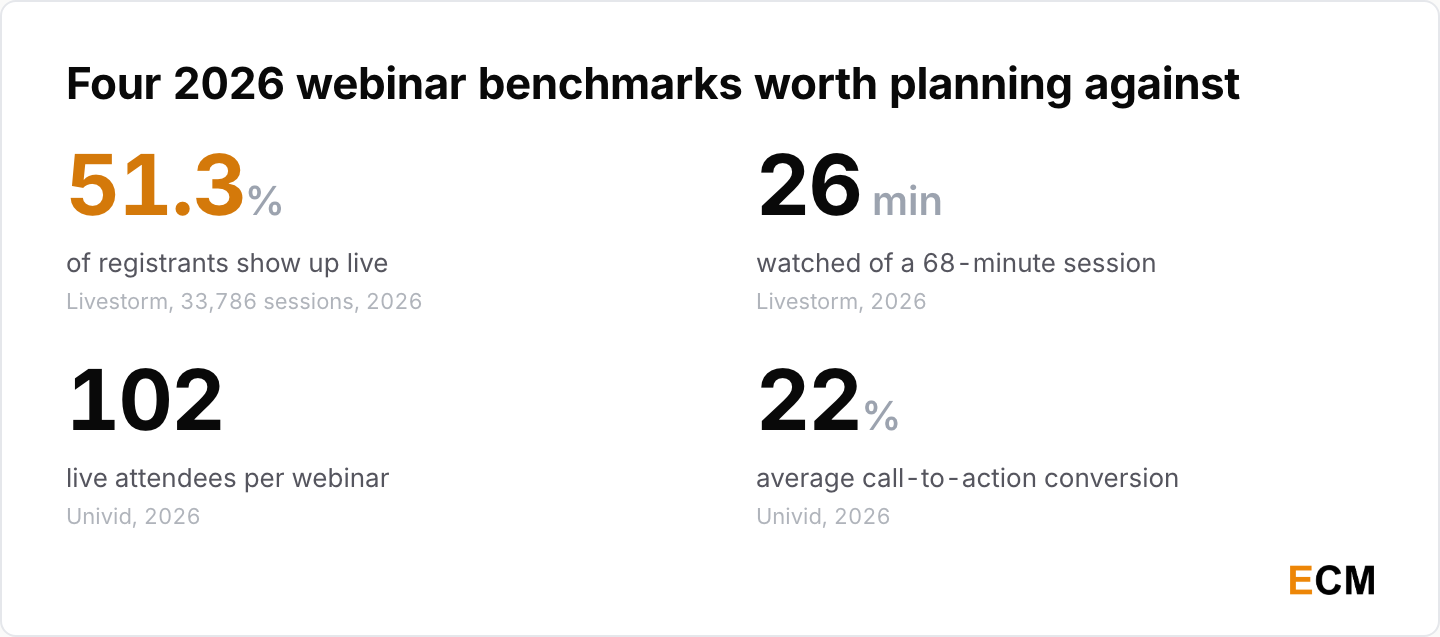
- Attendance runs 40% to 60% and nobody agrees on the middle. ON24 reports 60% (ON24, 2026), Livestorm 51.3% (Livestorm, 2026), Univid 49% live (Univid, 2026) and Wistia about 40% (Wistia, 2026).
- Watch time is the number that splits the field. Livestorm measures 26 minutes of a 68-minute session (Livestorm, 2026); ON24 measures 49 minutes of engagement (ON24, 2026).
- The average webinar is small. Half draw fewer than 50 live attendees and 71% draw fewer than 100 (Univid, Webinar Statistics Report, 2026).
- Gating the replay costs most of its audience. Public replays average 14.60 on-demand views against 3.97 for gated ones (Livestorm, 2026).
- Engagement features track with conversion. The average call to action converts at 22%, rising to 33% when polls, reactions, chat and Q&A are all on (Univid, 2026).
- Buyers still rank webinars near the top. 65% named webinars and digital events among the formats most valuable to their decisions, second to short-form content at 67% (Demand Gen Report, Content Preferences, 2024).
Webinar Attendance Rate Benchmarks for 2026
Registration and attendance is where webinar stats disagree most. Five platforms measured it and produced five answers, because each counts its own customers against its own definition of attended.
What Counts As A Good Attendance Rate
The honest answer is a band. The average live attendance rate spans a range wide enough that picking the top of it will make your own program look broken.
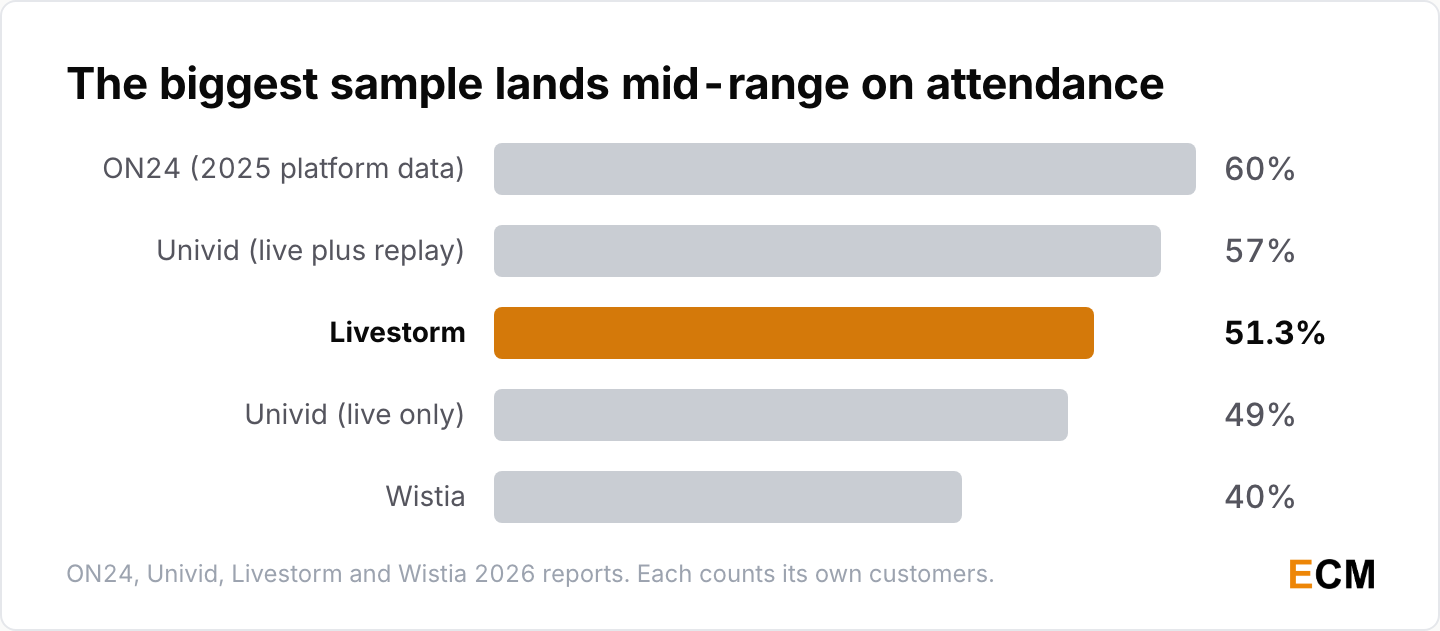
- Registration-to-attendance lands between 40% and 60%: ON24 60% (ON24, 2026), Livestorm 51.3% (Livestorm, 2026), Univid 49% live (Univid, 2026) and Wistia about 40% (Wistia, 2026).
- Counting replay viewers moves Univid’s figure to 57% (Univid, 2026), and Contrast puts the average live attendance rate at 44% to 50% across more than a million randomly selected registrants (Contrast, Webinar Statistics, 2026).
- Livestorm’s reading rests on the largest disclosed sample anyone publishes: 33,786 sessions from 3,199 organizations and 7,062,572 registrations across 2025 (Livestorm, 2026).
- This page has called 35% to 45% a good conversion rate since 2021, and reported 55% converting to attendees. Both readings have moved: only Wistia at 40% still sits inside that band (Wistia, 2026), and ON24’s own figures are 57% on 2024 data (ON24, 2025) and 60% on 2025 data (ON24, 2026).
Wistia’s customers skew toward smaller marketing teams and Univid’s sample is 70% European, so these are genuinely different populations. Plan against the platform closest to your own size and market, not the biggest number you can find. The webinar software you run on is part of the answer.
How Big The Average Webinar Is
Every headline webinar audience number is a mean pulled upward by a thin tail of very large events.
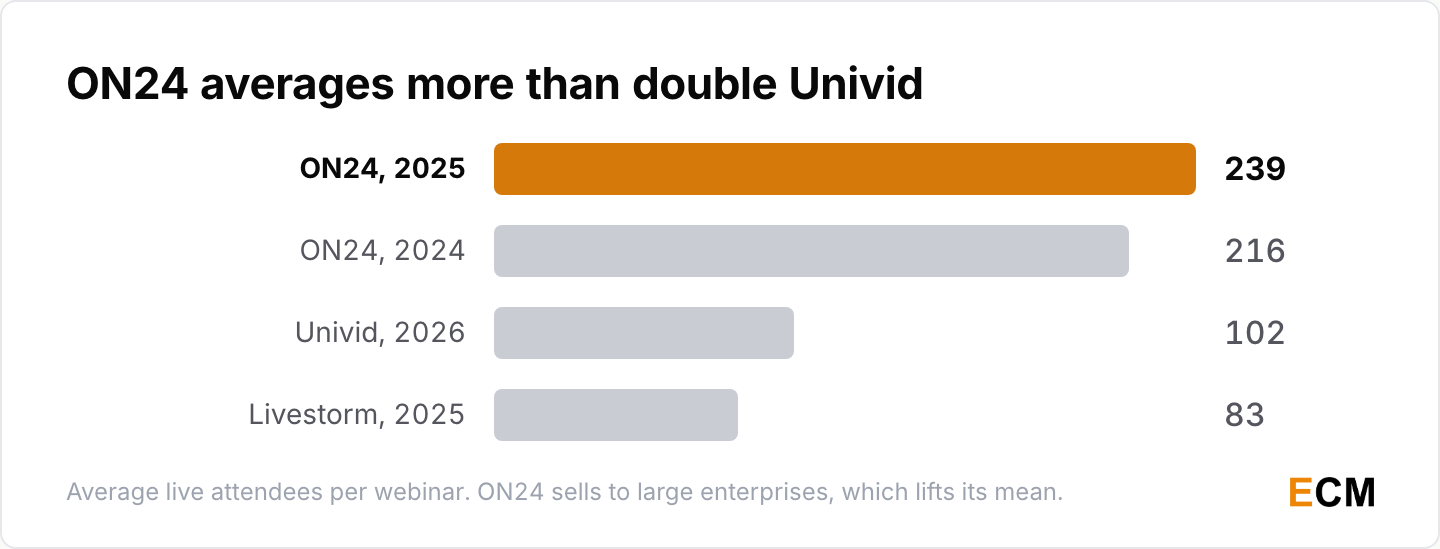
- Univid reports 102 live attendees per webinar, but 71% draw fewer than 100, half draw fewer than 50, and only about 1% break 1,000 (Univid, 2026).
- Livestorm’s average program looks like 175 registrants, 83 live attendees and 92 no-shows (Livestorm, 2026), and the pattern is not new: GoTo put 78% of webinars at 50 or fewer attendees back in 2019 (GoTo, Webinar Benchmarks, 2019).
- ON24 runs roughly double everyone else because it sells to large enterprises: 239 attendees per webinar in 2025, up 11% year over year (ON24, 2026) from 216 in 2024 (ON24, 2025).
Why Registrants Do Not Show Up
Smaller invite lists post higher live attendance rates, which is the opposite of how most teams set webinar registration targets.
- Webinars with fewer than 100 registrants post 6% higher live attendance than bigger ones, and the average webinar only pulls 128 registrants to start with (Contrast, 2026).
- 61% of registrants do eventually watch, live or on replay, which still leaves almost four in ten who never turn up at all. Only 37% of viewers stay to the end of a 60-minute session (Contrast, 2026).
Webinar Engagement Statistics And Watch Time
How long webinar attendees stay is the widest disagreement in the webinar data, and the gap comes down to what each webinar platform counts as watching.
How Long People Actually Watch
Watch time is the webinar performance number I plan against, so put the thing people need to hear inside the first 25 minutes.
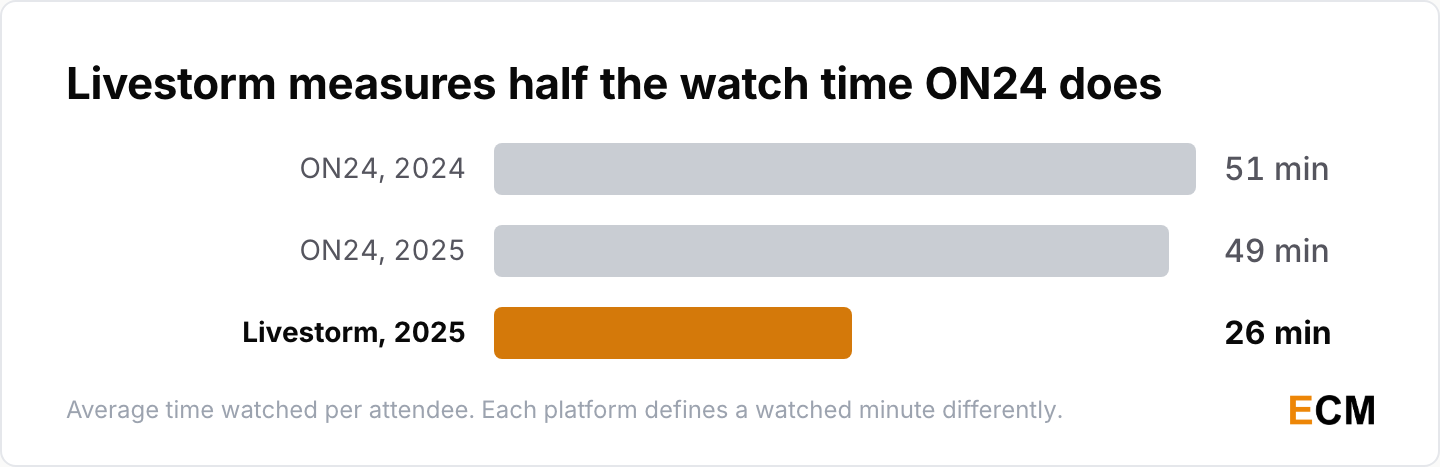
- Livestorm measures a 68-minute average session and 26 minutes of watch time, or 38% of the session (Livestorm, 2026).
- ON24 reports 49 minutes of engagement in 2025 (ON24, 2026), against 51 minutes on its 2024 data (ON24, 2025).
- Wistia sits closer to ON24: more than half of attendees keep the webinar tab open the whole time and stay for almost the entire event (Wistia, 2026).
- The “nearly an hour” session everyone quotes comes from GoTo’s benchmarks, published in 2019 and never refreshed. This page carried ON24 at 56 minutes on 2020 data and a State of Webinars reading of 53 minutes (GoTo, 2019).
The same pattern shows up across formats in the video marketing statistics and the podcast statistics.
What Attendees Do During The Session
Engagement and conversion move together here, and turning the features on costs nothing.
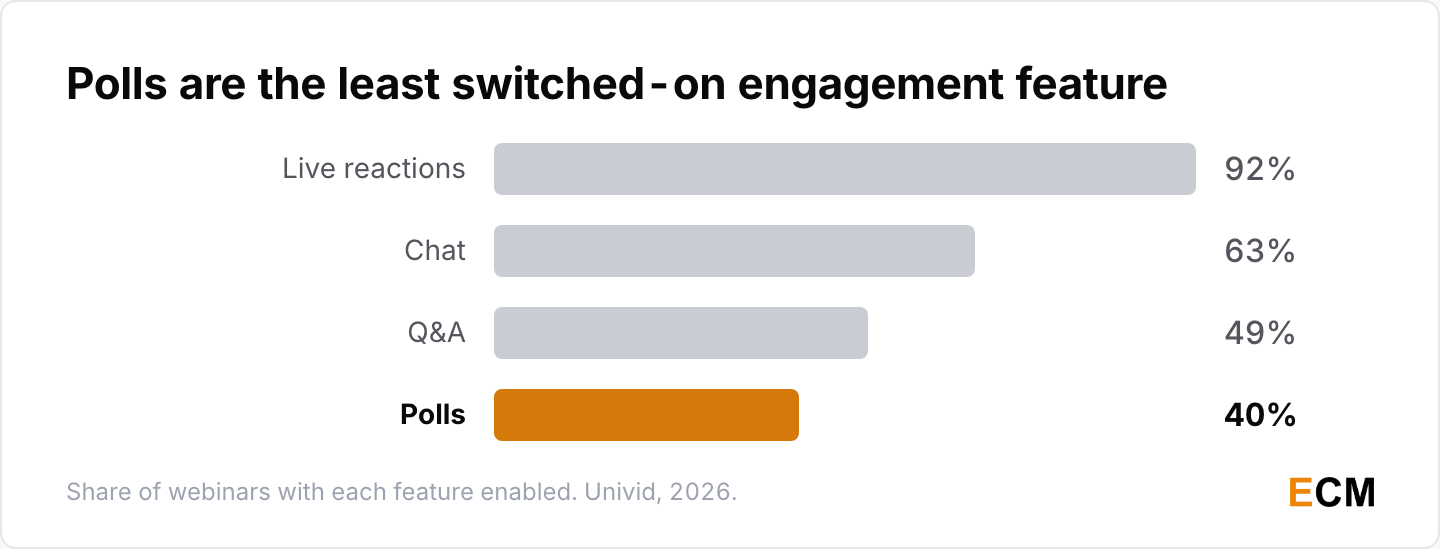
- Live reactions are enabled on 92% of webinars, chat on 63%, Q&A on 49% and polls on 40% (Univid, 2026).
- Actual participation is thinner than adoption suggests: 15.4% of attendees participate actively and each sends 0.58 chat messages on a 60 to 75 minute session (Livestorm, 2026).
- ON24’s larger events clear 300 interactions each, averaging 150 poll responses, 101 resource downloads and 1.8 interactions per attendee, with reactions per attendee up 18% year over year (ON24, 2026).
- Q&A was the tool this page called most effective at 81% in 2021. It is now third on adoption at 49%, behind reactions at 92% and chat at 63% (Univid, 2026).
How Long The Replay Keeps Working
Webinar replays are the asset with the longest life, and gating one is the most expensive habit in this data.
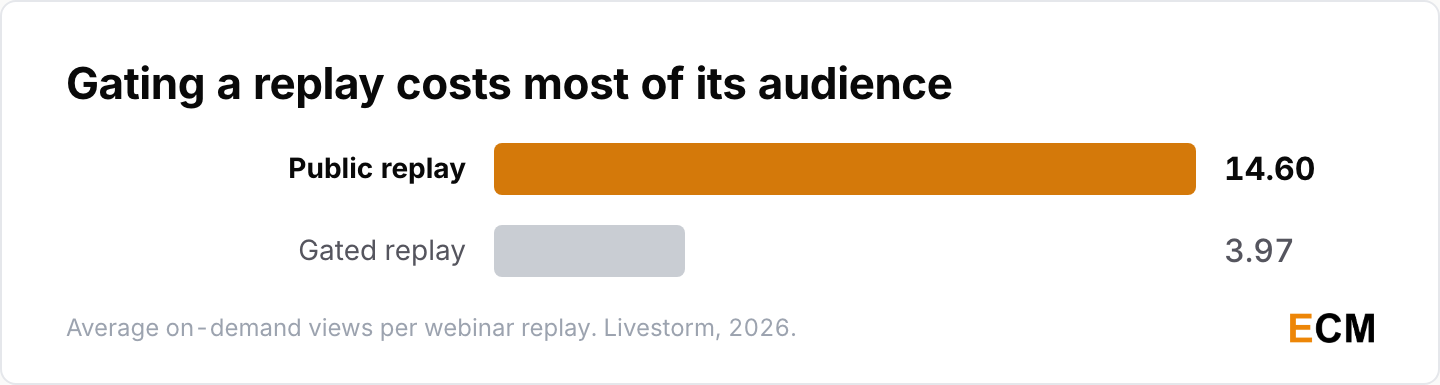
- Public replays average 14.60 on-demand views against 3.97 for gated ones, which Livestorm labels 368% more, a ratio rather than an increase (Livestorm, 2026).
- A third of webinars are still pulling plays three months after the live event, and 60% of marketers turn webinars into on-demand recordings (Wistia, 2026).
- On Univid’s platform 86% of views happen live, 24% of attendees watch replay only, 14% watch both, and 41% of people who miss the live session come back for it. Univid publishes each as a separate median, so they do not reconcile into one funnel (Univid, 2026).
- ON24 reports 2025 attendance at 67% live and 43% on demand (ON24, 2026); these categories overlap. Contrast puts on-demand at 42% of all views (Contrast, 2026).
- On-demand engagement lands between 15% and 20%, and replays running 31 to 45 minutes see more than twice the engagement of those under 30 minutes (Wistia, 2026).
Getting a clean recording out of the session is a webinar recording software question before it is a distribution one.
Webinar Conversion Rate And ROI Statistics
The average conversion rate is the one figure the platforms agree on, mostly because only Univid publishes a full call-to-action benchmark.
What The Average Webinar CTA Converts At
Two cheap changes buy higher conversion: add a second call to action, and do not schedule over lunch.
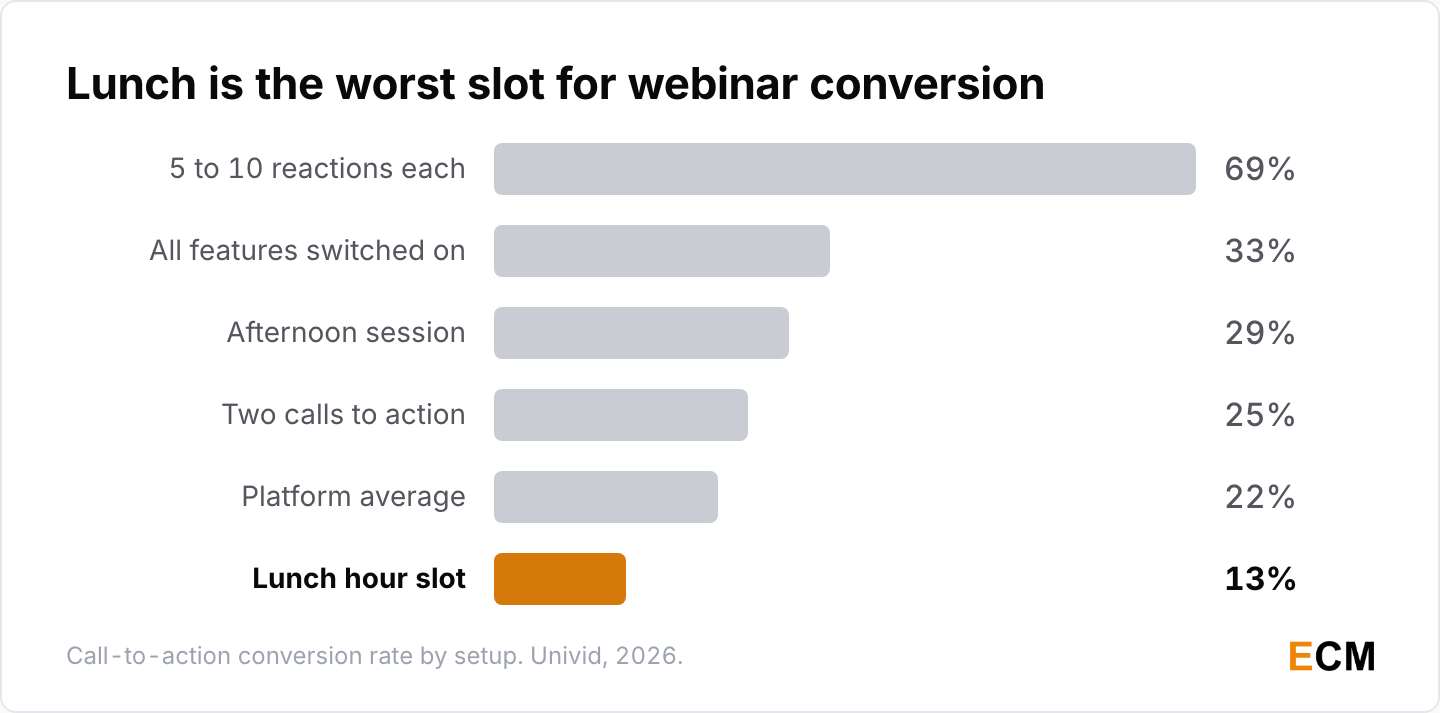
- The average webinar call to action converts at 22%, 30% of webinars run without one at all, and adding a second lifts conversion to 25% (Univid, 2026).
- Switching on polls, reactions, chat and Q&A together lifts conversion from that 22% average to 33% (Univid, 2026).
- Afternoon sessions convert at 29% against 22% in the morning and 13% over the lunch hour (Univid, 2026).
- Webinars drawing 0 to 1 reactions per attendee convert below 20%, while those drawing 5 to 10 convert at 69% (Univid, 2026).
That last one is correlation, not proof. Webinars people care about get reactions and also convert. Switching the features on still costs nothing.
What Personalization Changes
Personalization is ON24’s own product line, so treat the size of the lift as directional and the direction as real.
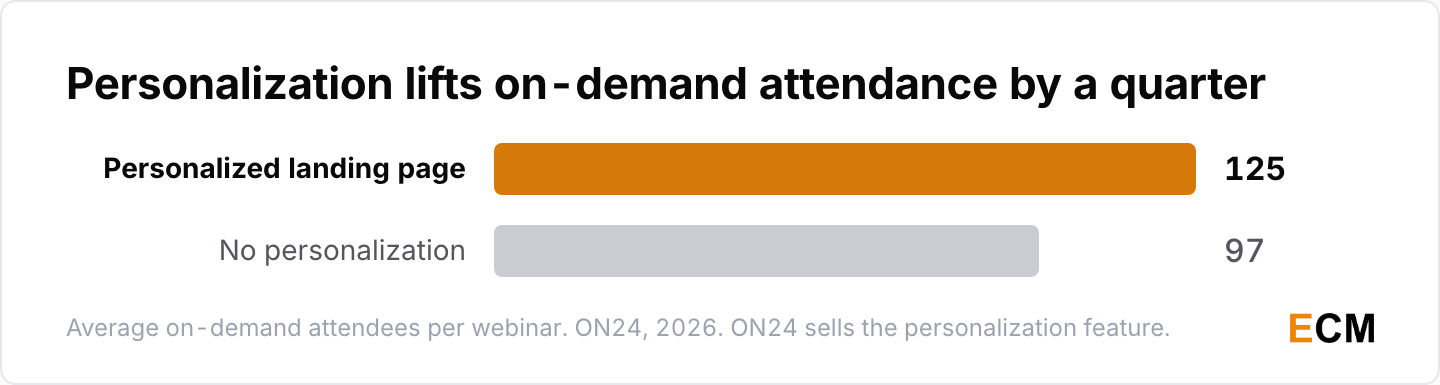
- Average on-demand attendance rises from 97 to 125 when the landing page is personalized, which ON24 calls a 25% increase even though the two figures imply 29% (ON24, 2026).
- Personalized pages lifted call-to-action clicks 118% against pages without personalization, while clicks from personalized landing pages rose 49% year over year and on-demand views per content hub rose 95% (ON24, 2026).
- Only 22% of B2B marketers personalize their webinars, against 85% who personalize email (Content Marketing Institute, 2026).
Given the numbers above, that 22% is the cheapest gap on this page to close.
What Webinars Return And What They Cost
Lead generation and pipeline are the webinar goals teams name, and the cost side has no published benchmark.
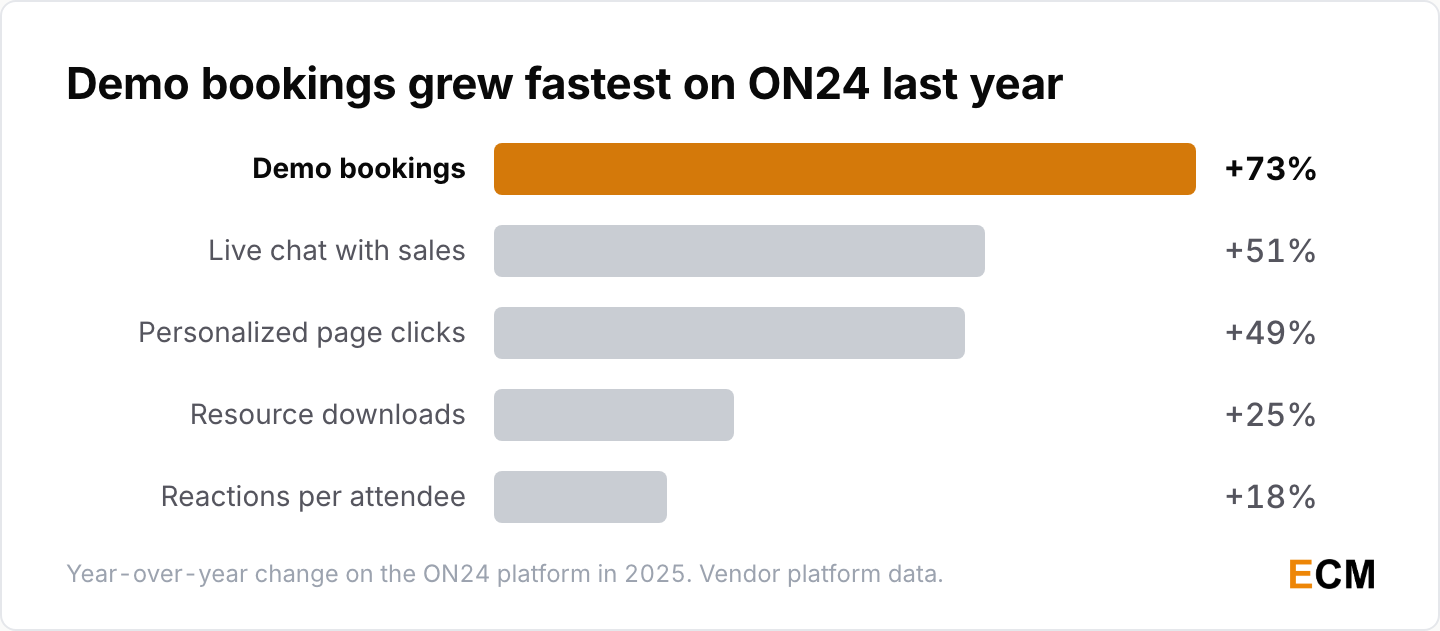
- Demo bookings rose 73% year over year on ON24’s platform in 2025, meeting bookings grew 4x and live chat with sales rose 51%. That growth measures a different outcome from the 68% of marketers who told ON24 in 2021 that webinars helped them tie activity to revenue (ON24, 2026).
- Pipeline generation is the top goal for 53.9% of go-to-market teams, ahead of brand awareness at 53.6% and customer expansion at 53.1% (Livestorm, 2026).
- Budgets are lean: about 8 in 10 companies spent under $10,000 on webinars last year (Wistia, 2026).
- There is no published cost per webinar lead. First Page Sage’s 2026 cost-per-lead report, built on data collected from January 2022 through June 2025, is organized by industry and carries no webinar line (First Page Sage, 2026).
Best Webinar Length, Day, And Time
The advice on hosting a webinar that marketers have followed since 2017 turns out to be roughly right, and the 2026 datasets disagree on the details.
How Long A Webinar Should Be
Sixty minutes is the default webinar format, and whether it earns that on attendance depends on which platform you ask.
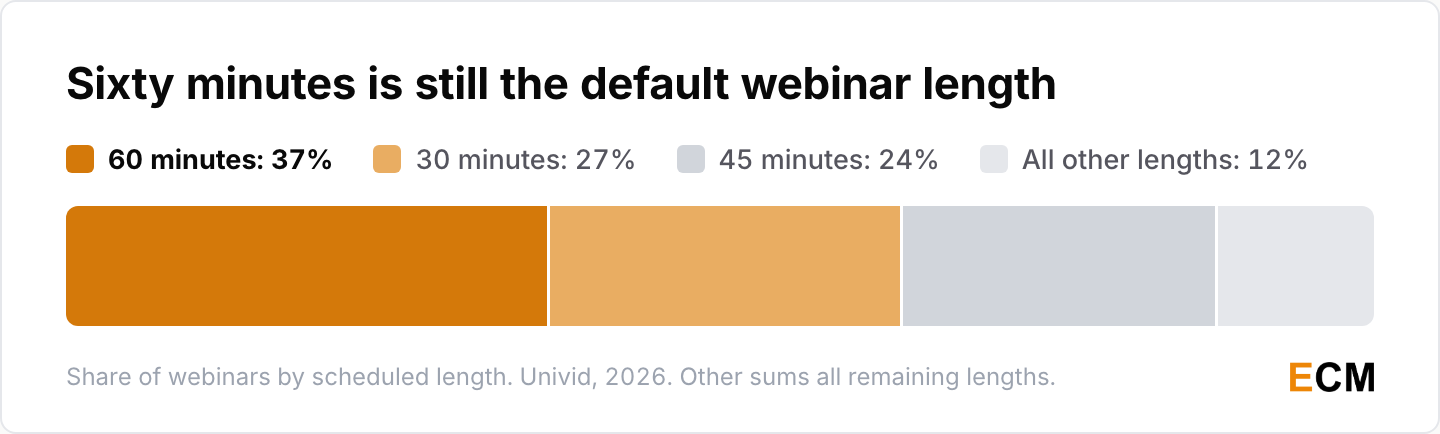
- 60 minutes is the most common length at 37% of sessions, followed by 30 minutes at 27% and 45 minutes at 24%, with everything else sharing the last 12% (Univid, 2026).
- 60-minute webinars post the best attendance and conversion on Univid’s platform, at 62% and 26% (Univid, 2026).
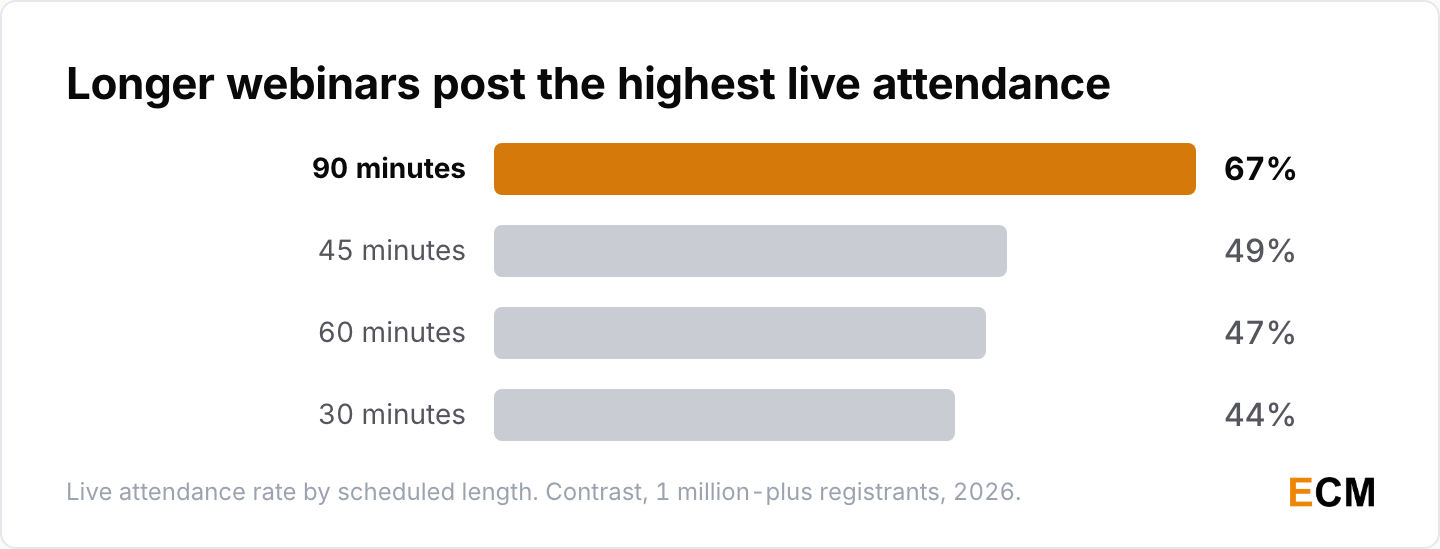
- Contrast finds the opposite ordering, giving 90-minute sessions the highest attendance rate at 67% to 72%, then 45-minute at 49%, 60-minute at 47% and 30-minute at 44% (Contrast, 2026).
- The 60-minute habit is nine years old. GoTo’s benchmarks put 67% of registrations on 60-minute webinars against 8% on 30-minute ones (GoTo, 2019).
The Best Day To Host A Webinar
Mid-week held. The best days to host webinars moved, and the current datasets do not agree on where.
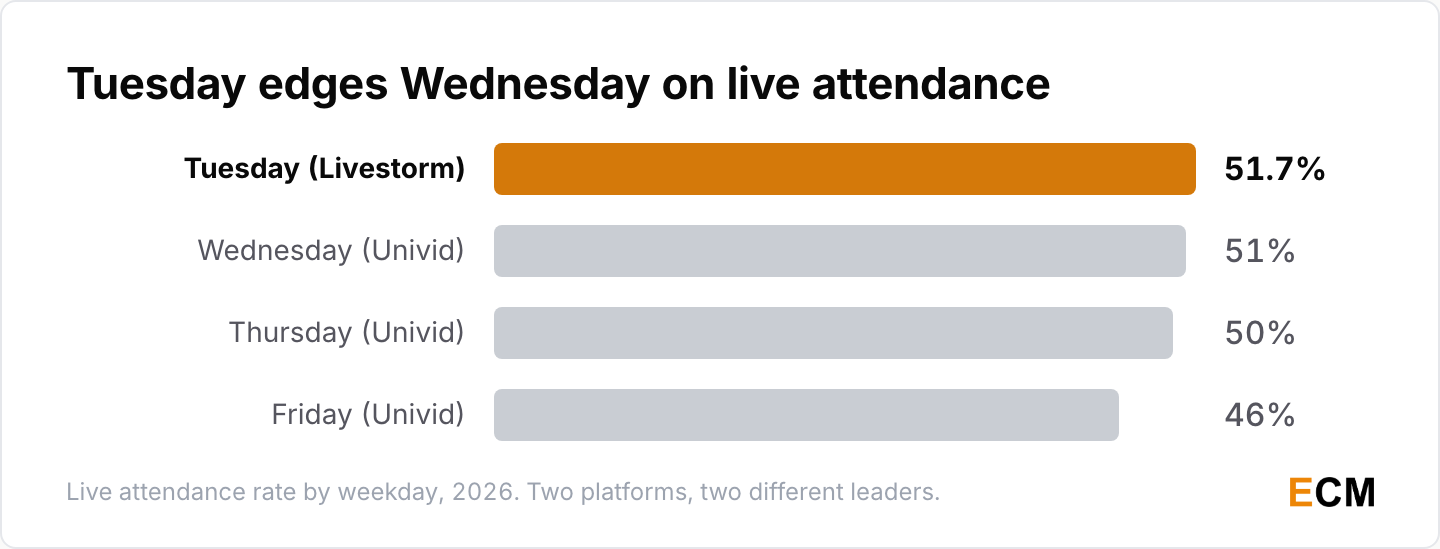
- Tuesday peaks at a 51.7% show-up rate, while Wednesday draws the largest audience at 94 attendees on a 51% show-up rate (Livestorm, 2026).
- Univid puts Wednesday first on attendance at 51%, then Thursday at 50% and Friday at 46%, while hosting concentrates on Tuesday at 30% and Thursday at 28% (Univid, 2026).
- Contrast puts Tuesday first at roughly 50% (Contrast, 2026), and 24% of all registrations arrive on a Tuesday (Contrast, 2026).
- Thursday led ON24’s 2019 report on 22,922 webinars from 2018 at 28% of attendees, against Wednesday 27% and Tuesday 24%. Those are shares of attendees, not of webinars, and GoTo puts Wednesday and Thursday at 26% each (GoTo, 2019).
The Best Time To Host A Webinar
Three independent datasets put the highest live attendance in the early afternoon, a nicer outcome than heritage advice usually gets.
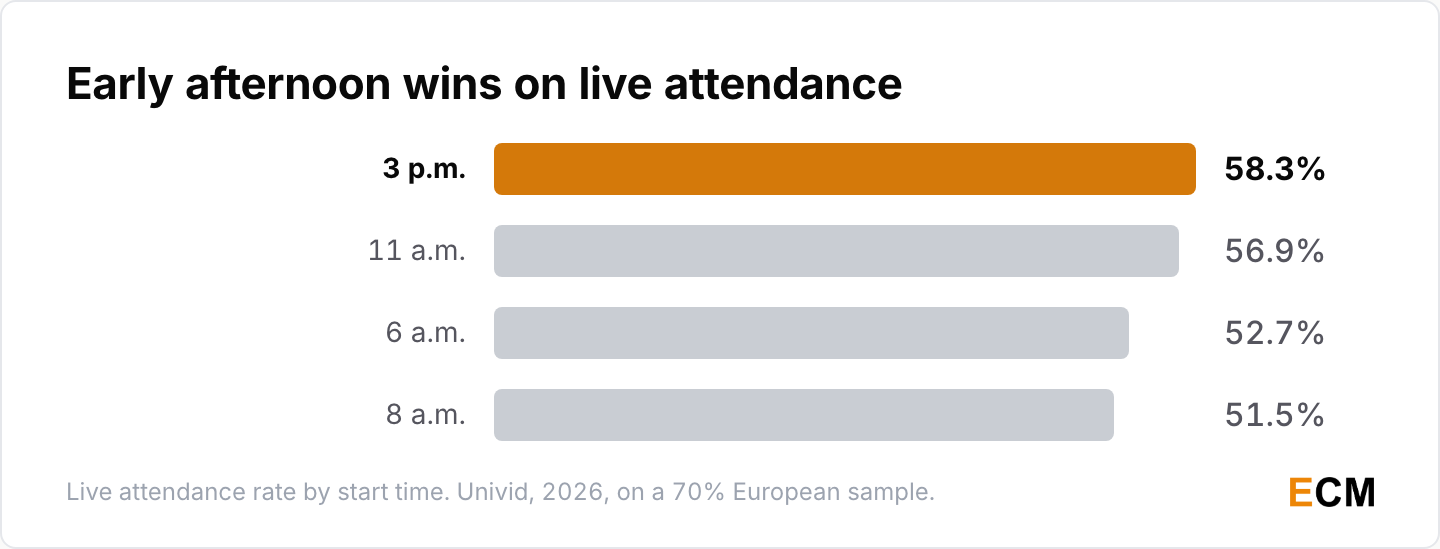
- Univid’s European-weighted sample puts 3 p.m. first at 58.3%, then 11 a.m. at 56.9%, 6 a.m. at 52.7% and 8 a.m. at 51.5% (Univid, 2026).
- Contrast puts 2 p.m. first at 53% to 55%, then 11 a.m. at 50% and 10 a.m. at 49% (Contrast, 2026).
- Livestorm names 11:00 a.m. and 2:00 p.m. Eastern as the optimal slots (Livestorm, 2026), the same 2 p.m. Eastern slot ON24 has recommended for years on a page with no dataset attached to it (ON24, undated).
When Registrations Arrive
Half your list signs up in the last seven days, so a webinar marketing plan that peaks early is aimed at the wrong week.
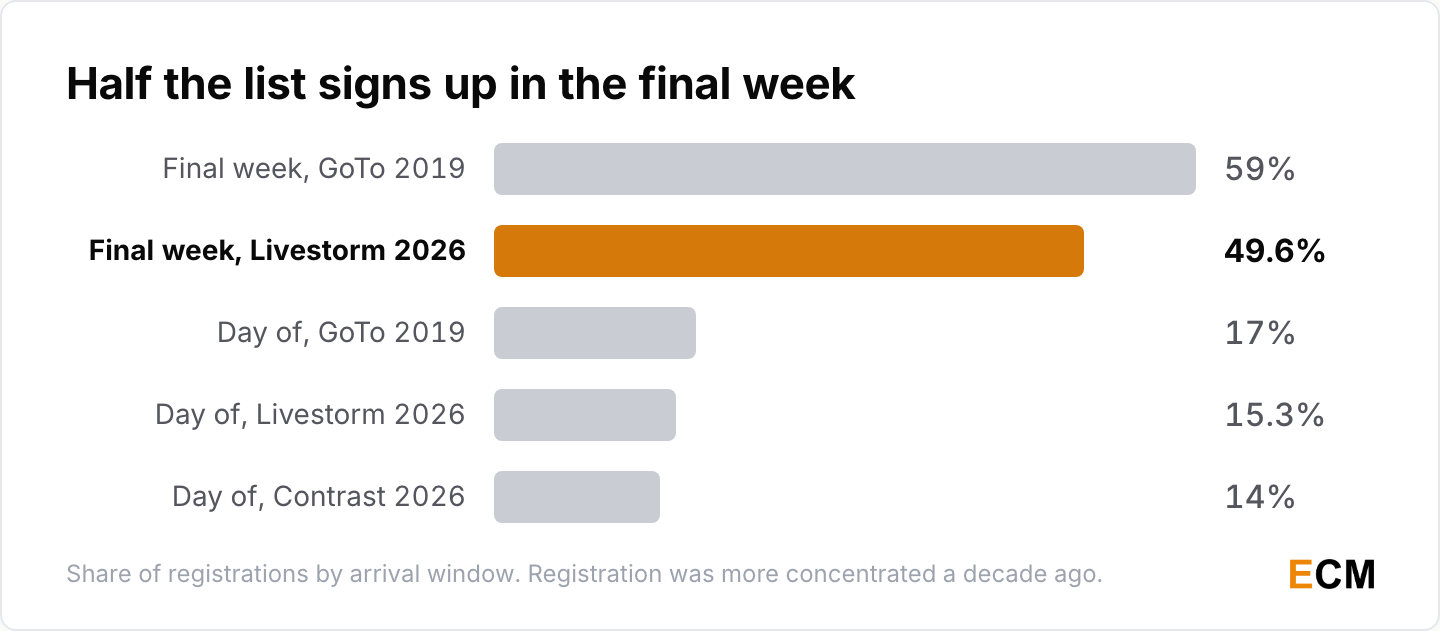
- 49.6% of registrations arrive in the final week, including 15.3% on the day and 26.2% at 2 to 6 days out; 16.4% arrive three or more weeks ahead (Livestorm, 2026).
- Contrast puts day-of registrations at 14% (Contrast, 2026), close to Livestorm’s 15.3% on a different platform (Livestorm, 2026).
- Registration was more concentrated a decade ago, not less. GoTo measured 59% in the final week and 17% on the day, against the 29% at 8 to 14 days out and 11% day-of this page carried from 2021 (GoTo, 2019).
How AI Is Changing Webinars In 2026
Two things are true at once in any 2026 webinar strategy. Adoption is broad and growing fast, and the measured quality of what the models produce is still uneven.
AI Adoption Across Webinar Programs
Repurposing, not the live session, is where the AI money actually lands.
- 87% of B2B marketers are already using or testing AI, and 63% of those who have implemented it use it for promotional content, the most common use case (ON24, 2026).
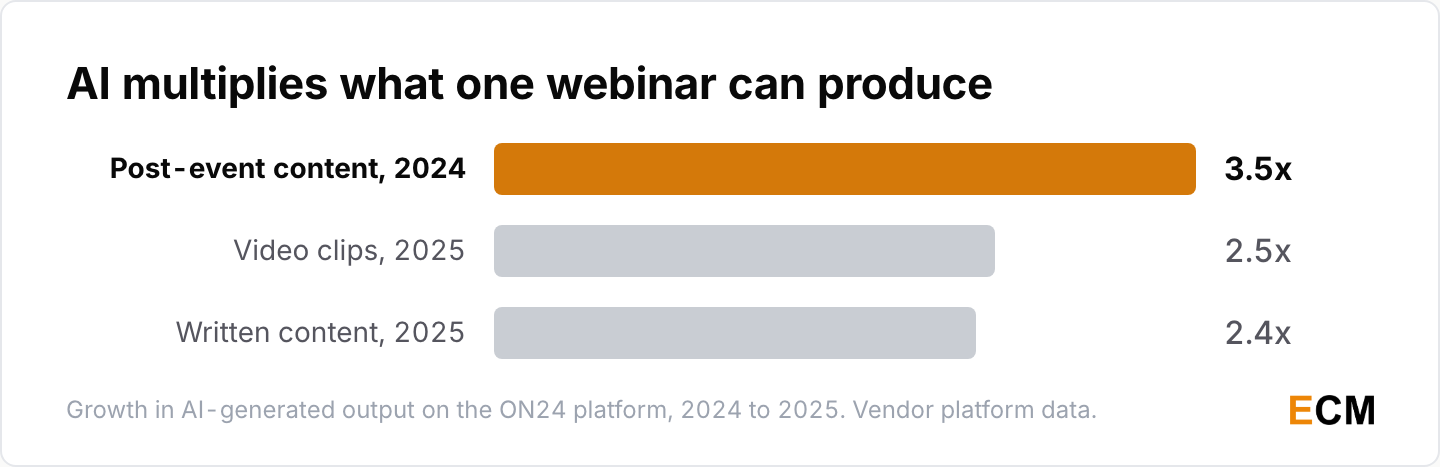
- Use of ON24’s AI-powered Analytics and Content Engine rose 37% in 2025, alongside 2.5x more video clips and 2.4x more written content (ON24, 2026), a year after SmartText use for promotional copy rose 72% and AI-generated post-event content grew 3.5x (ON24, 2025).
- Contrast puts the payoff at more than 16,000 hours and $800,000 a year saved by AI repurposing features (Contrast, 2026).
Why AI Webinar Summaries Still Fail
The marketing claim is that AI turns one webinar into a week of content. The measured failure mode is that the model drops things quietly.
- Researchers annotating 200 machine-generated meeting summaries built a taxonomy of nine distinct error types, including omission, structure and irrelevance (Kirstein et al., arXiv, 2024).
- A September 2025 paper on GPT-4o meeting summaries reports that its authors’ method reduces hallucination and omission by 2 out of 5 points on the QMSum and FAME benchmarks (Kirstein et al., arXiv, 2025).
Small samples in academic settings, not product benchmarks. They belong on the same page as the adoption numbers anyway.
How B2B Buyers And Marketers Rank Webinars
The demand side and the supply side tell the same story from opposite ends: buyers rate live webinars highly, and marketers keep them second behind in-person events.
What B2B Buyers Say They Value
The buyer-side webinar report that matters most here is two years old, which is itself the finding.
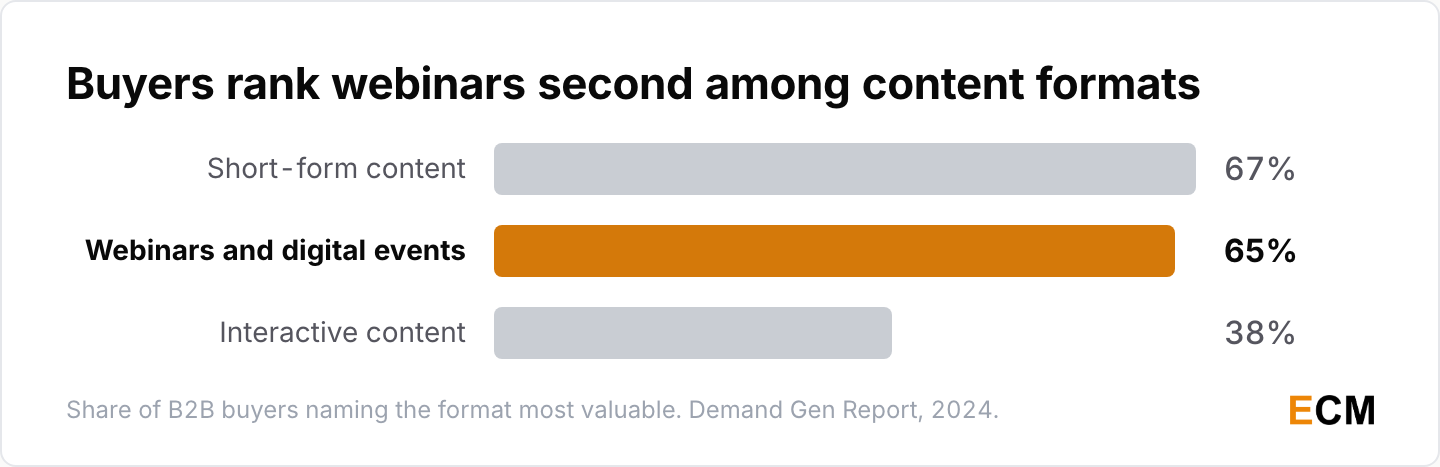
- 65% of B2B buyers named webinars and digital events among the formats most valuable to their decisions, second to short-form content at 67% and up 13 points from 52% the year before, while interactive content went the other way and fell to 38% (Demand Gen Report, 2024).
- The complaint underneath it is relevance: 51% of buyers said the content they met was too generic, up from 38% a year earlier, while 89% found their own assets and 72% passed them to colleagues (Demand Gen Report, 2024).
- Marketers rate webinars the second most impactful video type, and 81% of teams now share video on LinkedIn against 76% on YouTube (Wistia, 2026).
Where Webinars Rank As A Channel
B2B webinar programs sit second, twice, in the largest content survey anyone runs.
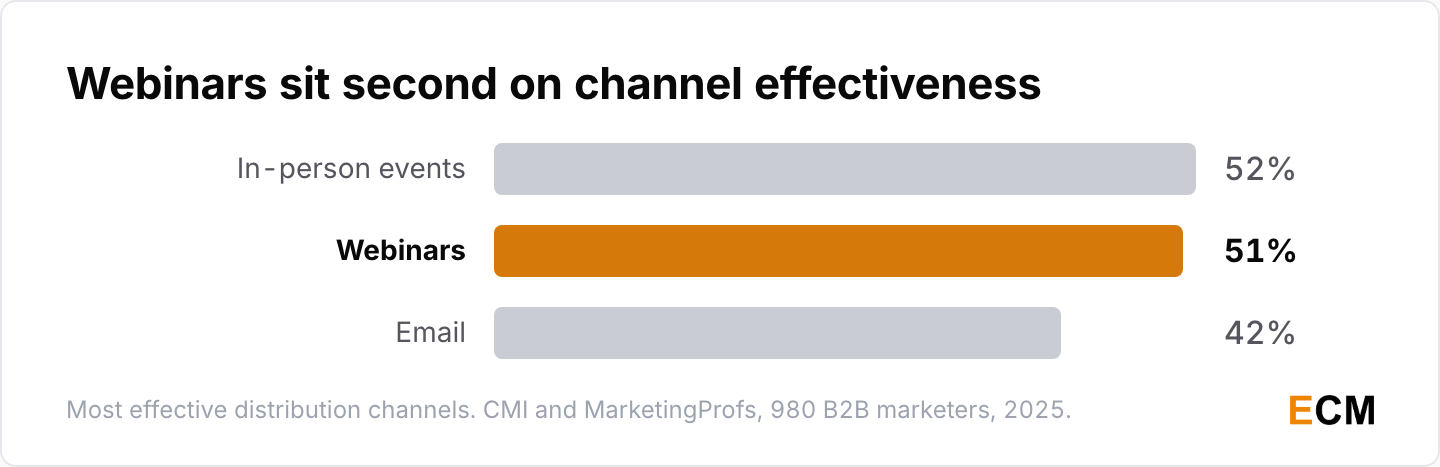
- Webinars were the second most effective distribution channel at 51%, behind in-person events at 52% and ahead of email at 42%, even though only 55% of B2B marketers used them against 89% on organic social and 84% on blogs (Content Marketing Institute, 2025).
- Speaking events and webinars rank third for publishing thought leadership at 52%, behind LinkedIn at 76% and email newsletters at 54% (Content Marketing Institute, 2026).
- Webinars were the second-fastest-growing B2B event type, behind small hosted in-person events at 58% (Forrester, State of B2B Events, 2024).
- Two years on, the number of organizations planning more virtual events doubled year on year, while nearly 70% are running fewer events overall and just 18% plan more large hosted ones (Forrester, 2026).
The wider picture is in the content marketing statistics.
Frequently Asked Questions
What Is A Good Webinar Attendance Rate?
The benchmark depends on whose platform you use. ON24 reports 60% (ON24, 2026), Livestorm 51.3% across 7,062,572 registrations (Livestorm, 2026), Univid 49% live (Univid, 2026), Contrast 44% to 50% (Contrast, 2026) and Wistia about 40% (Wistia, 2026).
What Is The Average Webinar Conversion Rate?
The average call to action converts at 22%, rising to 25% with a second call to action and 33% when polls, reactions, chat and Q&A are all enabled (Univid, 2026). Afternoon sessions convert at 29% against 13% over lunch (Univid, 2026). On ON24’s platform, demo bookings rose 73% year over year in 2025 (ON24, 2026).
How Long Should A Webinar Be?
Sixty minutes is the most common length at 37% of sessions and posts both the best attendance at 62% and the best conversion at 26% (Univid, 2026). Contrast finds 90-minute sessions attract the highest attendance instead, at 67% to 72% (Contrast, 2026). I put the important part early: Livestorm measures average watch time at 26 minutes (Livestorm, 2026).
What Is The Best Day And Time To Host A Webinar?
Tuesday or Wednesday, early afternoon. Livestorm finds Tuesday peaks at a 51.7% show-up rate (Livestorm, 2026), Contrast puts Tuesday first at roughly 50% (Contrast, 2026), and Univid puts Wednesday first at 51% (Univid, 2026). On time, Univid finds 3 p.m. best at 58.3% (Univid, 2026) and Contrast 2 p.m. at 53% to 55% (Contrast, 2026).
What Are Common Webinar Mistakes To Avoid?
Gating the replay, skipping the call to action and booking over lunch. Gated replays average 3.97 on-demand views against 14.60 for public ones (Livestorm, 2026). 30% of webinars run without a call to action, and lunch-hour sessions convert at 13% against 29% in the afternoon (Univid, 2026).
How Do You Measure Webinar Engagement And ROI?
Attendance rate, watch time, interactions and pipeline. Livestorm tracks active participation at 15.4% and 0.58 chat messages per attendee (Livestorm, 2026). ON24 reports more than 300 interactions per webinar and a separate 73% rise in demo bookings (ON24, 2026).
How Is AI Impacting Webinars In 2026?
Mostly after the event. 87% of B2B marketers are using or testing AI, and use of ON24’s AI-powered Analytics and Content Engine rose 37% in 2025 (ON24, 2026). The caveat is quality: researchers annotating 200 machine-generated meeting summaries catalogued nine distinct error types (Kirstein et al., arXiv, 2024).
Are Webinars Still Worth Running In 2026?
The demand side says yes. Buyers rank webinars second among content formats at 65% (Demand Gen Report, 2024), marketers rank them second among distribution channels at 51% (Content Marketing Institute, 2025), and organizations planning more virtual events doubled year on year (Forrester, 2026).
What Does A Webinar Cost?
Less than most teams assume, and nobody publishes a defensible cost per lead. About 8 in 10 companies spent under $10,000 on webinars last year (Wistia, 2026). First Page Sage’s 2026 cost-per-lead report is organized by industry and carries no webinar line (First Page Sage, 2026).
Written by
Editorial Staff
The Editorial Staff represents the writers, editors, and content creators who have worked (or work) at Elite Content Marketer. The experimenter-in-chief behind the team is Chintan Zalani, who has close to a decade of experience trying to make sense of the content marketing industry. Started in 2019, Elite Content Marketer is on a mission to help creators build sustainable businesses.
Related Articles

Marketing Data
58 AI Personalization Statistics for 2026: ROI + Adoption
58 AI personalization statistics for 2026: 78% of marketers can’t make enough personalized content, and 87% of brands rate it good while 29% of consumers agree.
Oct 2, 2026Read more →
Marketing Data
60 AI Workflow Automation Statistics for 2026
60 AI workflow automation statistics for 2026: 37% of respondents see any EBIT impact from AI, 6% are high performers, and agents scale at big firms.
Oct 1, 2026Read more →
Marketing Data
AI Image Generation Statistics 2026: 60 Data Points
60 AI image generation statistics for 2026: people now create more than 3 billion images a week with ChatGPT Images and OpenAI’s API.
Sep 30, 2026Read more →