Adobe’s Firefly models have generated more than 22 billion assets (Adobe, April 2025), the largest supply number in visual content statistics. 76% of US adults say it matters whether a picture came from a person or a machine (Pew Research Center, September 2025).
53 Visual Content Statistics for 2026
 Written by Editorial Staff
Key Takeaways
- AI image supply is measured in tens of billions. Adobe’s Firefly counter read 16 billion generations in December 2024 (Adobe) and 22 billion by April 2025 (Adobe).
- Consumers want labels they cannot produce themselves. 76% of US adults say it’s important to know whether content is AI-made, and 12% are confident they could tell (Pew Research Center, September 2025).
- Visual content is a mid-tier B2B format, not a top one. 57% of B2B marketers used data visualizations, well behind short articles at 92% (CMI and MarketingProfs, October 2024).
- The stock imagery consolidation did not happen. Getty Images terminated its $3.7 billion merger with Shutterstock on July 7, 2026 (Getty Images Form 8-K, July 2026).
- AI training data is the growth line in licensing. Shutterstock’s data and services revenue grew 16% in FY2025 against 4% for stock licensing (Shutterstock, February 2026).
- Trust in AI splits by market, not by technology. 87% in China against 32% in the United States, from one instrument fielded between October 17 and 27, 2025 (Edelman, November 2025).
- One design platform is most of the volume. 260 million people used Canva every month at the end of 2025, up from 220 million a year earlier (Canva, December 2025).
- The most-quoted visual stat has no original report. “65% of people are visual learners” goes back to a 2004 paper that states the figure and attaches no study (SSRN, 2004).
Visual Content Marketing Statistics for B2B Teams
The cleanest baseline for how much visual work B2B teams actually produce comes from CMI and MarketingProfs. Their 2026 edition swapped the format-share question for a self-reported pacesetter variable, so the October 2024 reading is still the most recent direct measurement.
Which Formats B2B Marketers Publish
Visual content lands fifth of the six formats CMI tracks, which is not where most roundups put it.
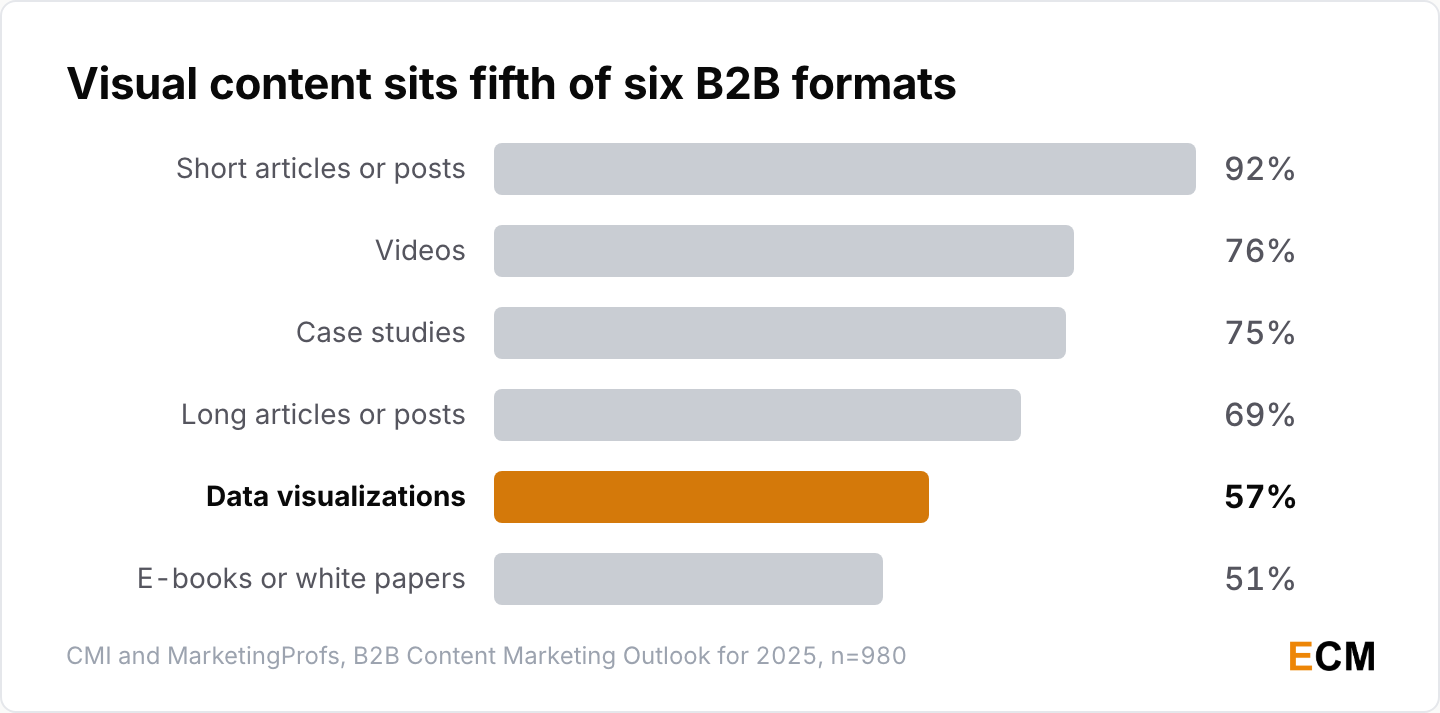
- Short articles or posts led B2B production at 92%, with videos at 76% (CMI and MarketingProfs, October 2024; n=980 B2B marketers).
- Case studies reached 75% and long articles 69% (CMI and MarketingProfs, October 2024).
- Data visualizations or visual content reached 57%, and e-books or white papers 51% (CMI and MarketingProfs, October 2024).
What that list misses is how visuals get used inside the other formats. A case study with six charts in it counts as a case study, so the 57% understates how much of a team’s production work is actually visual.
Which Formats Marketers Say Pay Back
Both the effectiveness ranking and the ROI ranking put moving pictures first, and both come from people grading their own work.
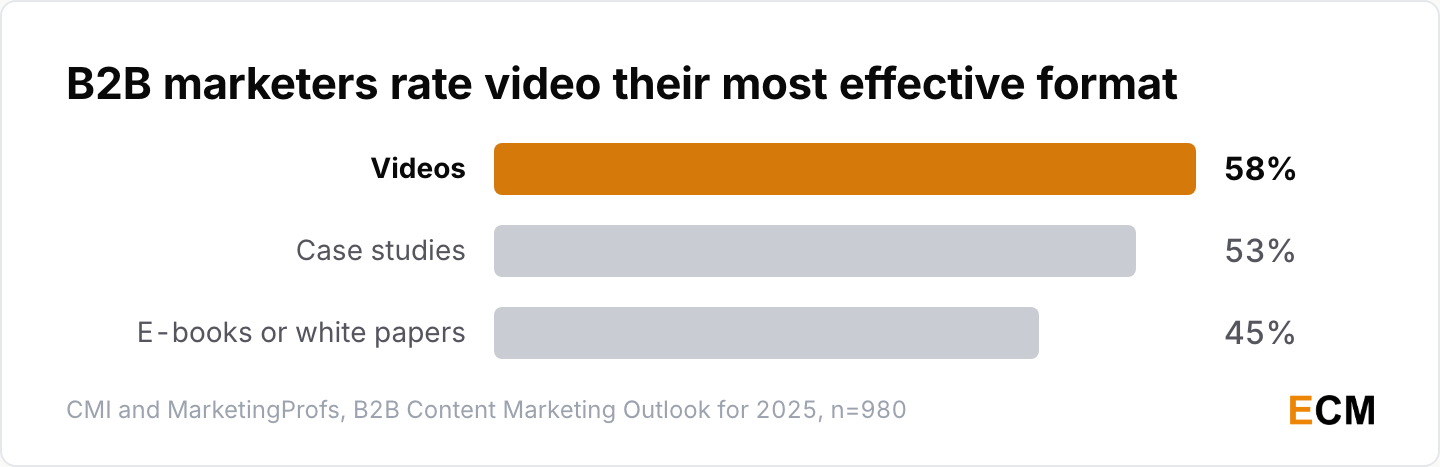
- 58% of B2B marketers rated videos their most effective format, with case studies at 53% and e-books or white papers at 45% (CMI and MarketingProfs, October 2024).
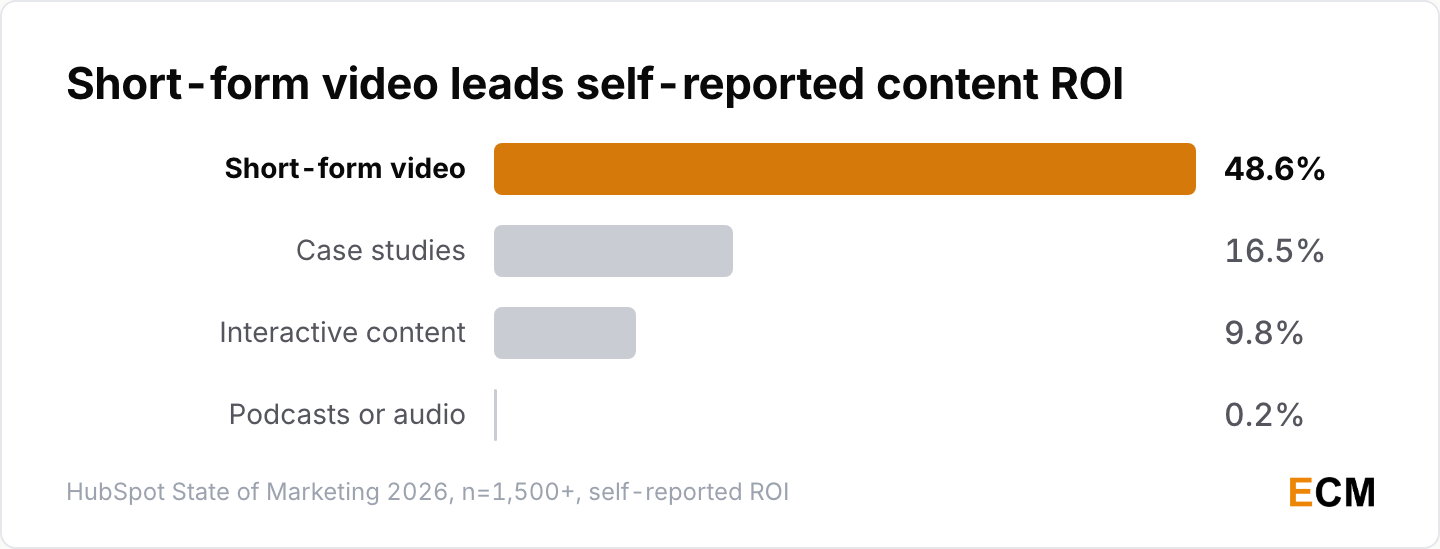
- 48.6% of marketers named short-form video their highest-ROI format, ahead of case studies at 16.5%, interactive content at 9.8% and podcasts or audio at 0.2% (HubSpot, 2026; n=1,500+).
- 22% said expanding from text into visual or audio content was their most effective diversification strategy in 2025 (HubSpot, 2026).
HubSpot sells the software these teams run their content through, so I read its ROI ranking as directional. The 0.2% for podcasts is the tell: that is a sampling artifact, not a performance finding. More of that data sits in the content marketing statistics roundup.
How Much Content Is Visual
Venngage runs the only recurring survey that asks marketers to quantify their own visual mix, and it sells infographic software to the people it surveys.
- 21.9% of marketers said more than three-quarters of their content was visual (Venngage, n=105, 2023 fielding).
- 34.3% put visuals in 20% to 50% of what they published (Venngage, 2023).
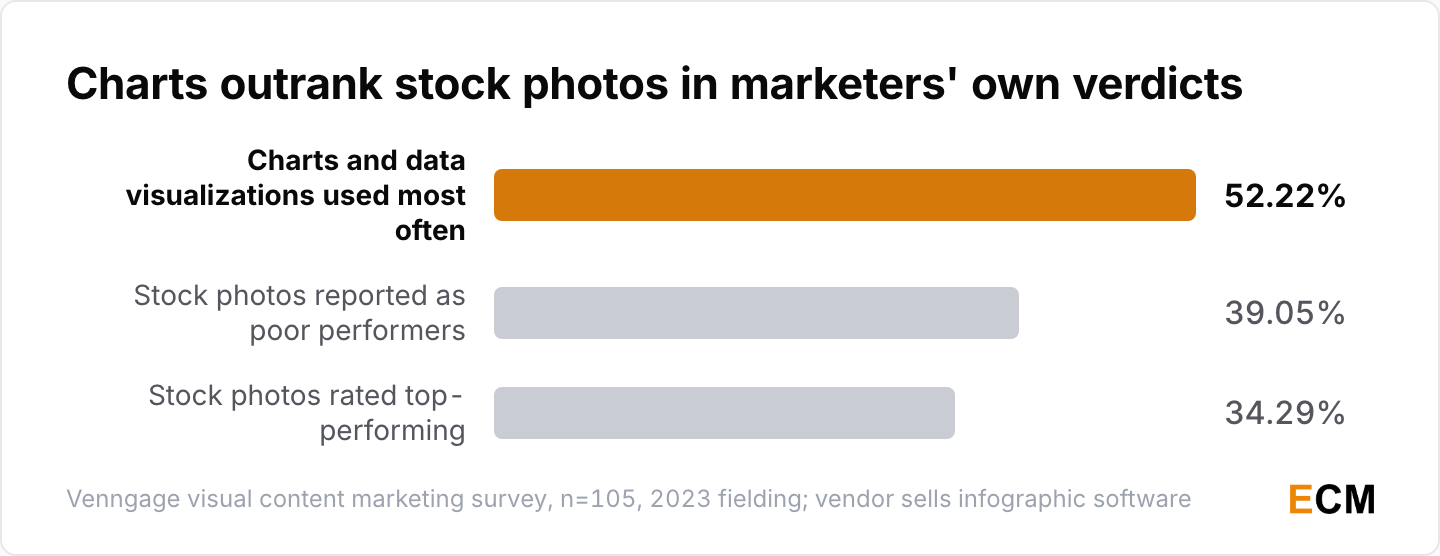
- 52.22% named charts and data visualizations the format they produced most often (Venngage, 2023).
- Stock photos split the room, with 34.29% rating them top-performing and 39.05% reporting they performed poorly (Venngage, 2023).
- More than 60% said they had rebuilt their visual content strategy (Venngage, 2023).
Venngage reports to two decimal places on 105 responses, which is more precision than that sample can carry, so read these as rough splits. The stock photo result is still the useful one. One format lands in opposite buckets for different teams, which matches what Nielsen Norman Group found with eye-tracking: pictures that carry information get read, decoration gets skipped.
AI Image Generation Statistics for 2026
Supply is the number that has actually moved. Adobe and Canva both publish counters, and both counters are company-reported rather than audited to public-company standards.
How Fast AI Generation Scaled
Adobe’s Firefly counter is the only public series that tracks AI image supply over time. Adobe’s own label for it shifts from generations to assets partway through.
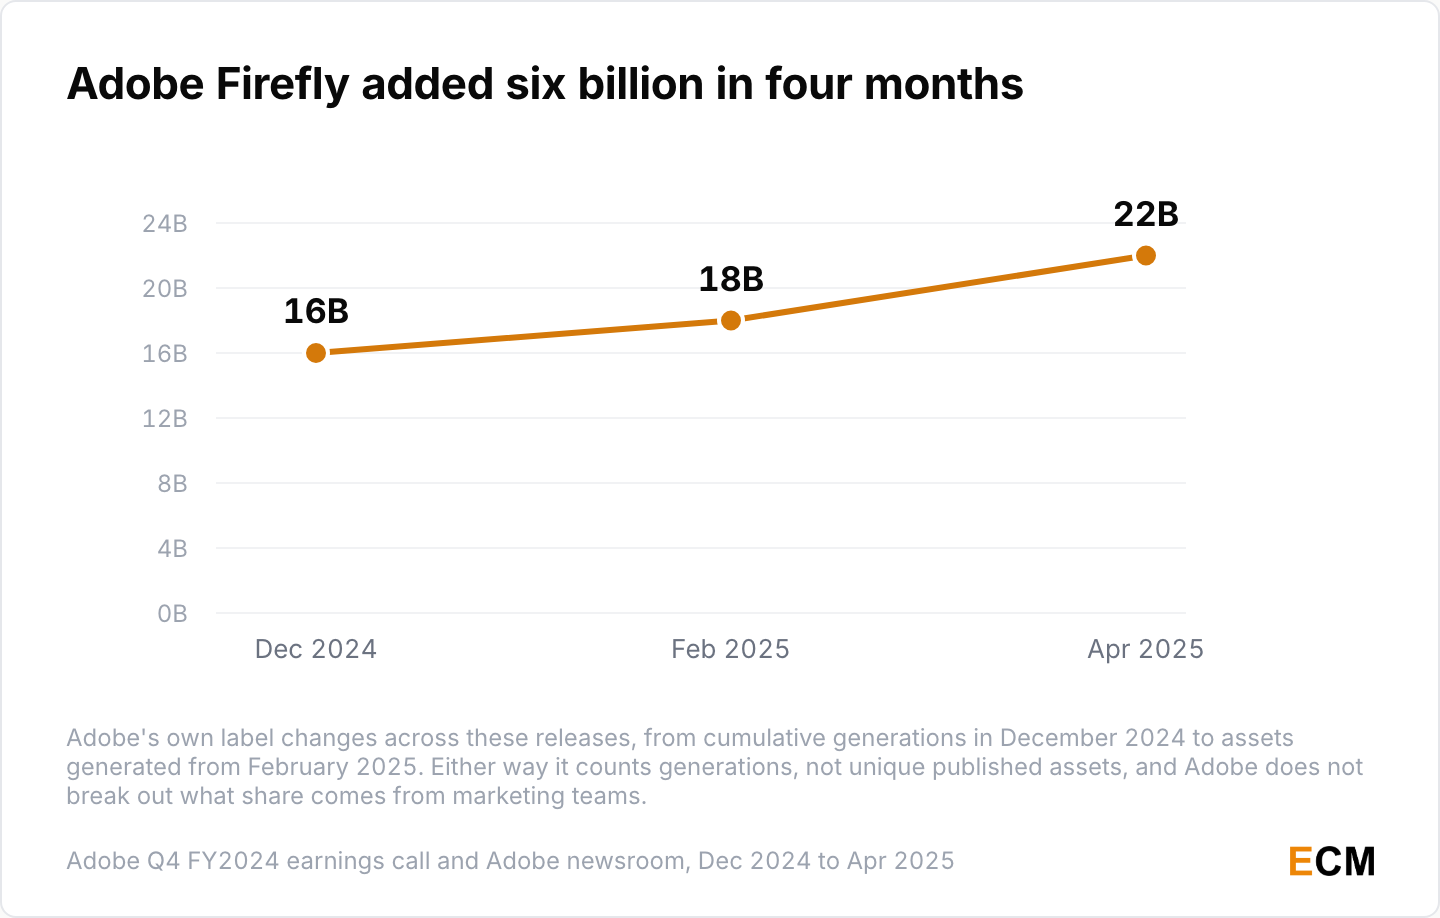
- Adobe’s Firefly counter read 16 billion cumulative generations in December 2024 (Adobe Q4 FY2024 earnings call), 18 billion assets by February 2025 (Adobe) and 22 billion by April 2025 (Adobe).
- Firefly now runs partner models from ElevenLabs, Google, Luma AI, OpenAI, Runway and Topaz Labs (Adobe MAX 2025, October 2025), with FLUX.2 and Nano Banana Pro added that December (Adobe, December 2025).
That second line has a consequence most teams miss. Made in Firefly no longer means made with Adobe’s commercially safe training data, so if your legal review leans on Firefly’s indemnity, somebody has to check which model produced each asset before it ships. That indemnity is a large part of why teams pick Firefly at all, which is where the Adobe Firefly review starts.
Platforms Behind AI Image Output
Canva is the closest thing to a usage proxy for design work that does not run through Adobe.
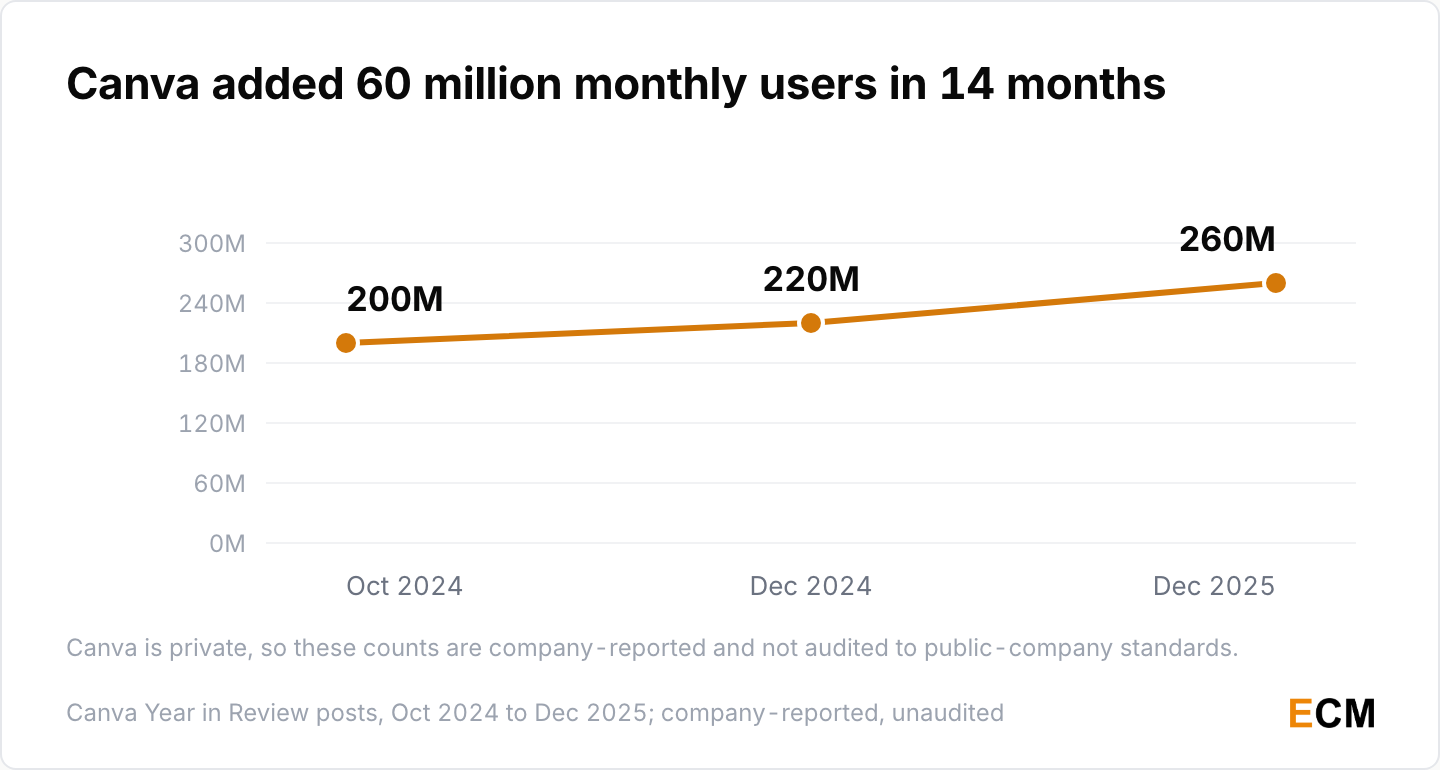
- Canva went from 200 million monthly users in October 2024 to 220 million that December (Canva) and 260 million by the end of 2025 (Canva).
- Canva reached $3.5 billion in revenue in 2025, with 100 million teachers, students and education leaders using it monthly (Canva; company-reported, unaudited).
- Figma’s research and development spending rose $586.3 million, or 356%, for the year ended December 31, 2024 (Figma Form S-1, July 2025).
- Adobe closed fiscal 2025 with $23.77 billion in revenue, up 11%, above the $23.30 billion to $23.55 billion it guided in December 2024 (Adobe Form 10-K, fiscal year ended November 28, 2025).
Adobe does not break out Adobe Stock as a revenue line, and it has not published a Creative Cloud subscriber count in a 10-K since fiscal 2015. Any article handing you a precise figure for either is quoting an aggregator rather than Adobe.
How Many Marketers Generate Visuals
Two surveys ask adjacent questions here, and swapping one for the other is how a fake trend line gets built.
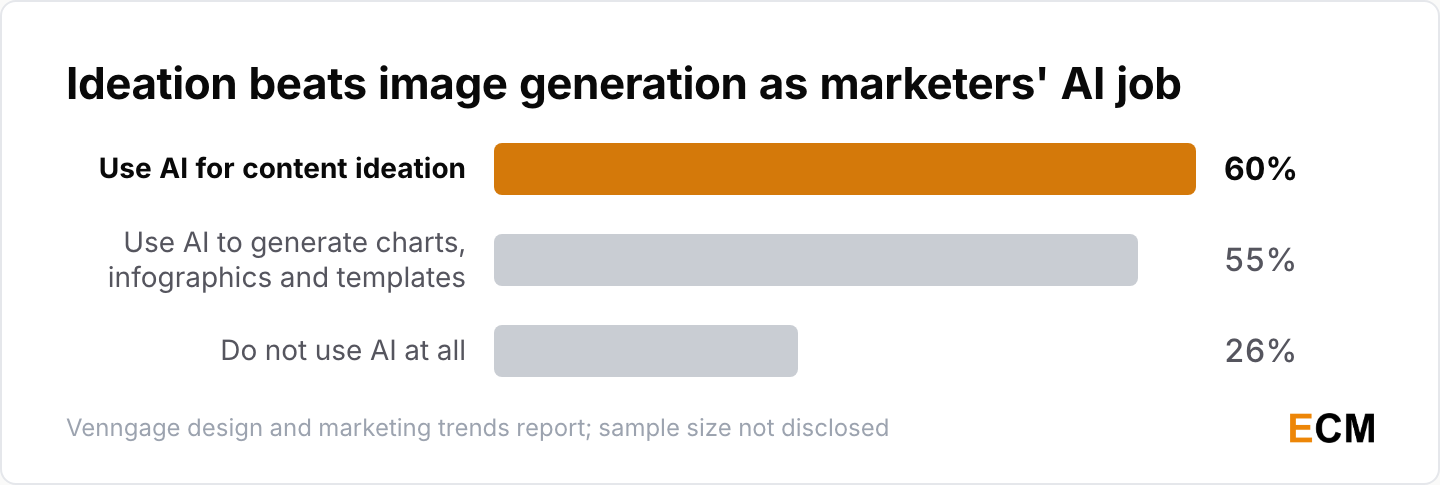
- 60% of marketers use AI for content ideation and 55% use it to generate charts, infographics and templates, while about 26% do not use AI at all (Venngage; sample size not disclosed).
- 48% said AI-generated content exceeded their expectations in 2025 (Venngage).
- 53% of B2B marketers use creative asset tools to generate and edit images, video and visual materials (CMI and MarketingProfs, October 2025; n=1,015, fielded June 24 to August 14, 2025).
- 74% of professionals call AI critically or very important to their success over the next 12 months, and 38% name a lack of education and training as the most-cited barrier to adoption (SmarterX, 2026; n=2,100+).
The 53% counts teams using AI tools to make images. The 57% further up counts teams publishing visual content at all. Different questions, different samples, no trend line between them.
Stock Photo and Visual Licensing Statistics
The stock imagery business has two halves now, and only one of them is growing at any speed.
What Licensing Earns Now
Shutterstock is the only stock library that reports audited numbers, which makes it the industry’s proxy.
- Shutterstock’s FY2025 revenue was $989.9 million, up from $935.3 million (Shutterstock, February 2026).
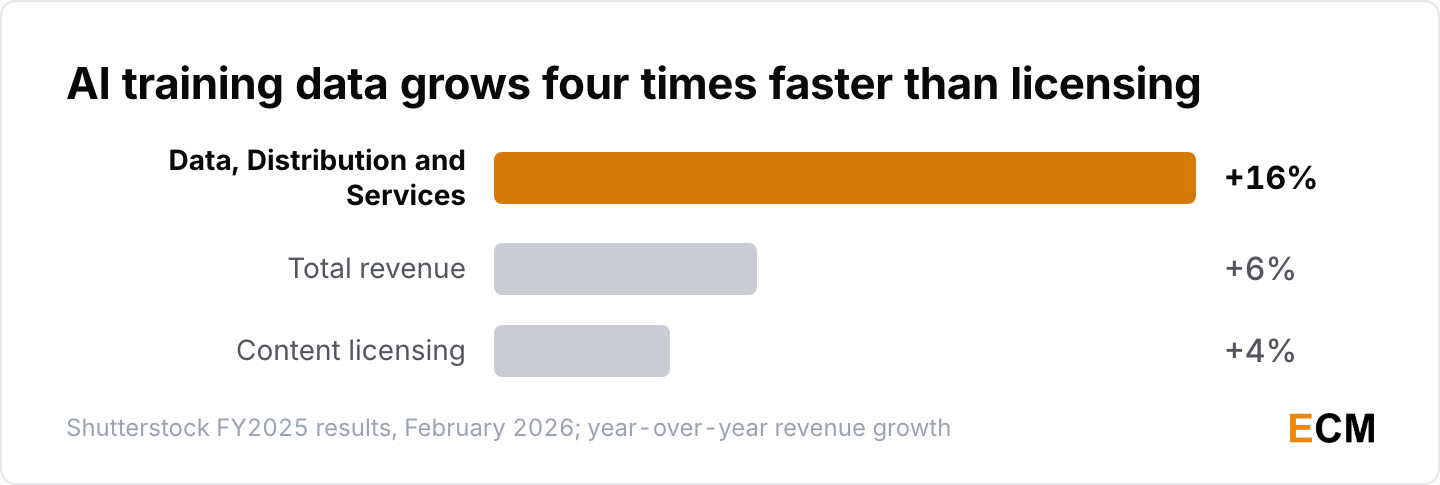
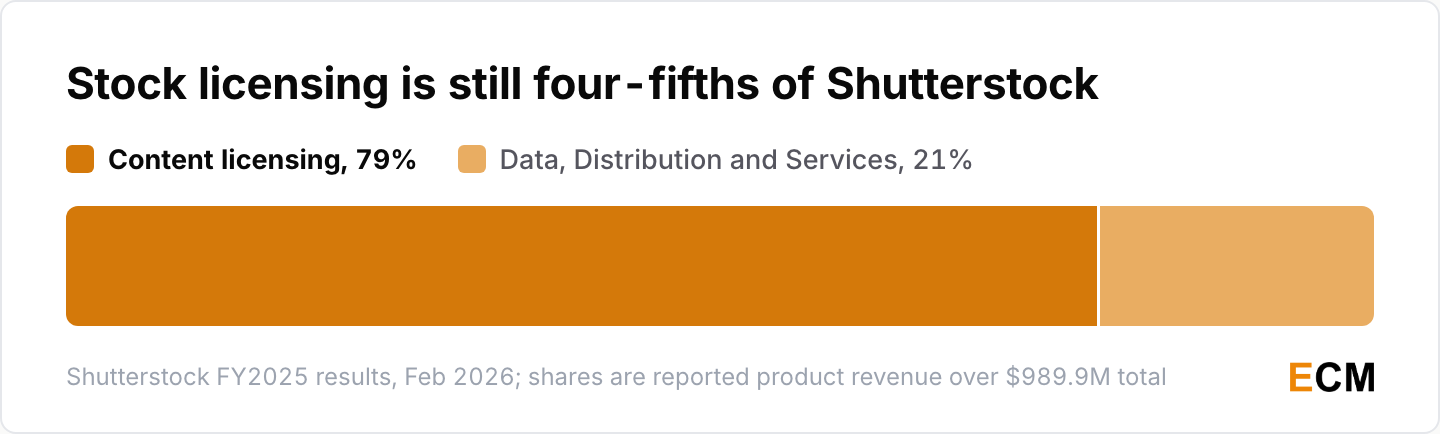
- Content licensing brought in $786.7 million, up 4%, and was 79% of the total (Shutterstock, February 2026).
- Data, Distribution and Services, the segment that carries its AI training-data business, brought in $203.3 million, up 16%, and was 21% of the total (Shutterstock, February 2026).
The gap between 4% and 16% is the whole story. The half that sells pictures to marketers grows at roughly the rate of inflation. The half that sells pictures to model builders grows four times faster.
Getty and Shutterstock Merger Outcome
If you are reading a 2026 article that treats the combined company as real, it was written before July and never revisited.
- Getty Images and Shutterstock announced a merger of equals on January 7, 2025 at a combined enterprise value of about $3.7 billion (Shutterstock 8-K exhibit, January 2025).
- The companies projected $150 million to $200 million in annual cost synergies by year three (Shutterstock 8-K exhibit, January 2025).
- The Hart-Scott-Rodino waiting period expired without conditions on February 23, 2026 (Shutterstock, February 2026).
- Getty Images terminated the agreement on July 7, 2026 after its board declined the UK Competition and Markets Authority’s condition that Shutterstock divest its entire editorial business (Getty Images Form 8-K, July 2026).
Getty Images Holdings and Shutterstock are two separate public companies. The $150 million in synergies was always a projection, and it is now a projection for a company that does not exist.
How Visual Content Performs on the Page
This is where the recycled numbers live. The real research on page-level visual performance is thinner and older than the roundups suggest.
What Eye-Tracking Studies Found
The honest answer on static imagery is that the best instrumentation is old.
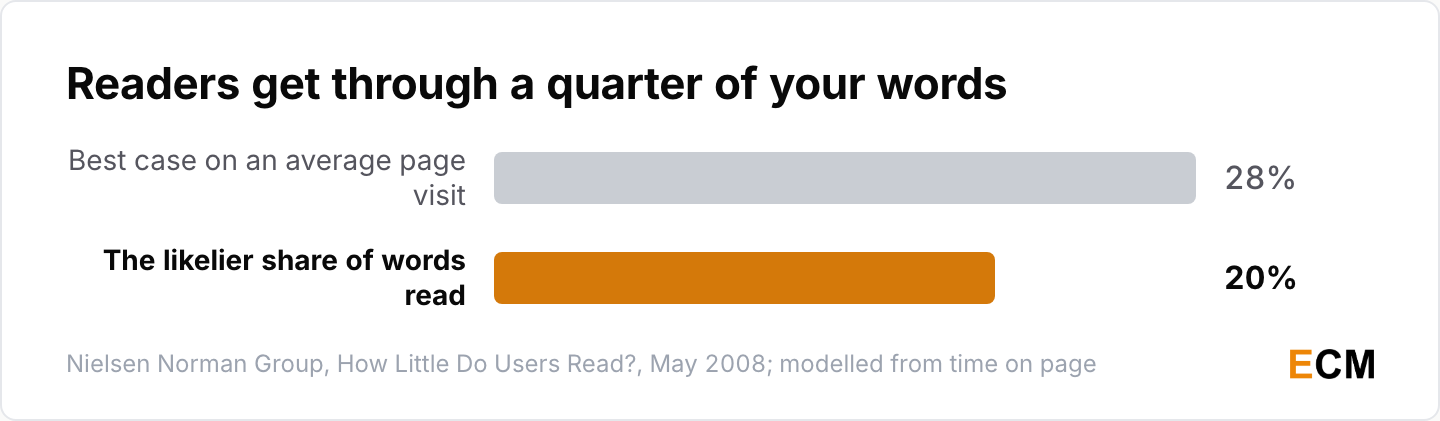
- Web users have time to read at most 28% of the words on an average page visit, and 20% is likelier (Nielsen Norman Group, May 2008).
- Color can improve brand recognition by up to 80% (Xerox; vendor one-pager, sources listed in aggregate and not tied to this figure).
Nielsen Norman Group’s eye-tracking work on photos as web content found something more useful than a percentage. Readers ignore feel-good decorative images and study product photos and pictures of real people. Design around that and the Venngage stock photo split stops looking like a contradiction.
How Many Visuals a Post Should Carry
Orbit Media has asked content marketers how many visuals go into a post for a decade, and the answer keeps changing shape.
- Marketers who use two to three visuals per blog post are the most likely to report strong results (Orbit Media, September 2026; n=1,042 content marketers).
- Orbit Media’s 2019 edition found that 3% of bloggers added ten or more images per article, and that group was 2.5 times likelier to report strong results (Orbit Media, 2019 edition).
The threshold moved and so did the answer. In 2019 the heavy-image group looked like the winners. The 2026 edition puts the sweet spot at two to three, which reads less like a reversal than like the difference between a chart that carries information and a gallery.
Where the Recycled Numbers Came From
A handful of claims carry most of the visual marketing folklore. Here is what each one actually rests on.
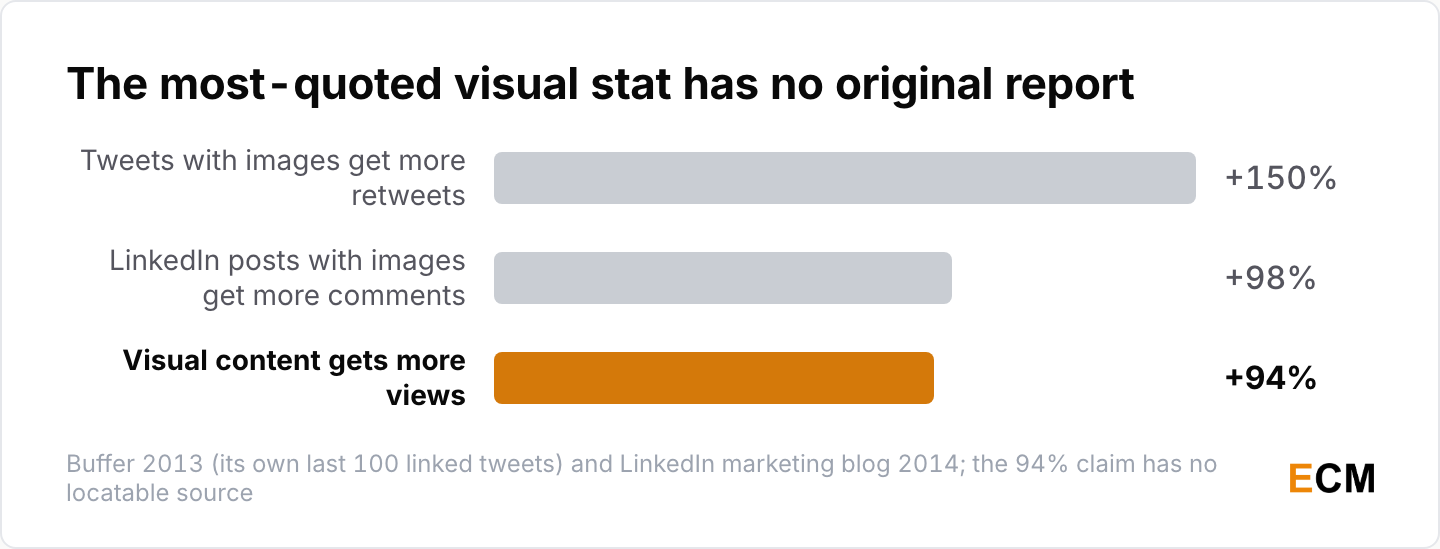
- “65% of people are visual learners” goes back to William C. Bradford’s Reaching the Visual Learner (SSRN, 2004, revised 2011), which states the figure and attaches no study to it.
- “People remember 65% of visual information after three days versus 10% of written” is really John Medina’s finding that you remember 10% of something you heard three days later and 65% if a picture came with it (Brain Rules). Quote it that way and it holds up.
- “Tweets with images get 150% more retweets” came from Buffer counting its own last 100 linked tweets in November 2013, several algorithm generations and one rebrand ago (Buffer, 2013).
The learning-styles framework behind the first claim is treated as a neuromyth in the peer-reviewed literature, including Pashler, McDaniel, Rohrer and Bjork in Psychological Science in the Public Interest, 2008, and Coffield, Moseley, Hall and Ecclestone, 2004.
“People remember 80% of what they see and 20% of what they read” is misattributed to Edgar Dale’s Cone of Experience, which carried no percentages at all. Subramony, Molenda, Betrus and Thalheimer disputed it formally in Educational Technology in 2014.
“The brain processes images 60,000 times faster than text” and “90% of information transmitted to the brain is visual” both trace to a 1996 or 1997 3M corporate marketing paper. Neither has a peer-reviewed source behind it.
“Visual content gets 94% more views” is attributed to Skyword or MDG Advertising depending on who repeats it, and neither published an original report. “Facebook posts with images get 2.3 times more engagement” is BuzzSumo, 2017. “LinkedIn posts with images get 98% more comments” came from LinkedIn’s own marketing blog in 2014 and was never refreshed.
“80% of people switch between online search and video while buying” is a Think with Google figure from a property Google has since folded into Google Business, so treat it as a claim Google made rather than a current measurement. Adobe’s Firefly market-share and revenue figures circulating in SEO content sit in the same bucket, attributed to Adobe but absent from any Adobe filing.
What Consumers Think About AI Visuals
Audience expectation is the part of this data that moved most between 2024 and 2026, and it moved against generated imagery.
AI Image Labeling and Detection
The distance between wanting disclosure and being able to detect it is the most actionable finding on this page.
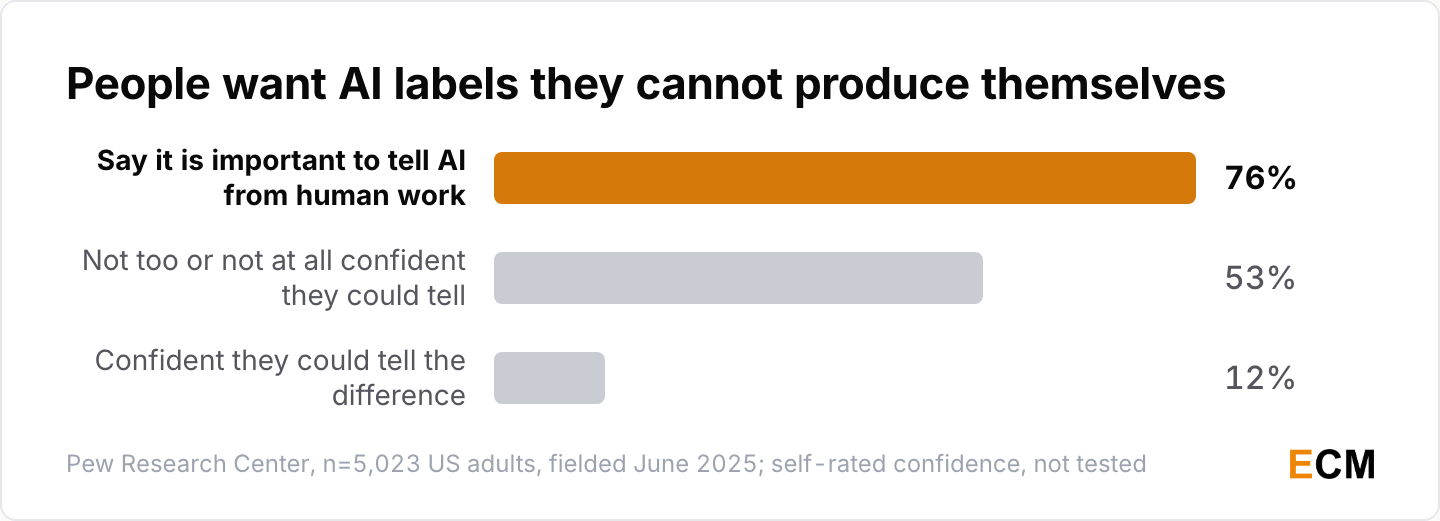
- 76% of US adults say it is extremely or very important to tell whether pictures, videos and text were made by AI or by people (Pew Research Center, September 2025; n=5,023, fielded June 9 to 15, 2025).
- 12% feel confident they could tell the difference themselves, and 53% say they are not too confident or not at all confident (Pew Research Center, September 2025).
- Half of US adults say increased AI use in daily life makes them more concerned than excited, up from 37% in 2021 (Pew Research Center, March 2026).
- 21% of US workers say at least some of their work is done with AI, up from 16% in 2024, while 65% say they do not use it much or at all (Pew Research Center, March 2026).
Pew’s detection figure is self-rated. Nobody showed these respondents a set of pictures and scored them, so I would read the 12% as a confidence measure rather than an accuracy measure. The burden sits with the publisher either way.
Trust in AI by Market
One instrument, five markets, ten days in October. That internal consistency is what makes the spread worth quoting at all.
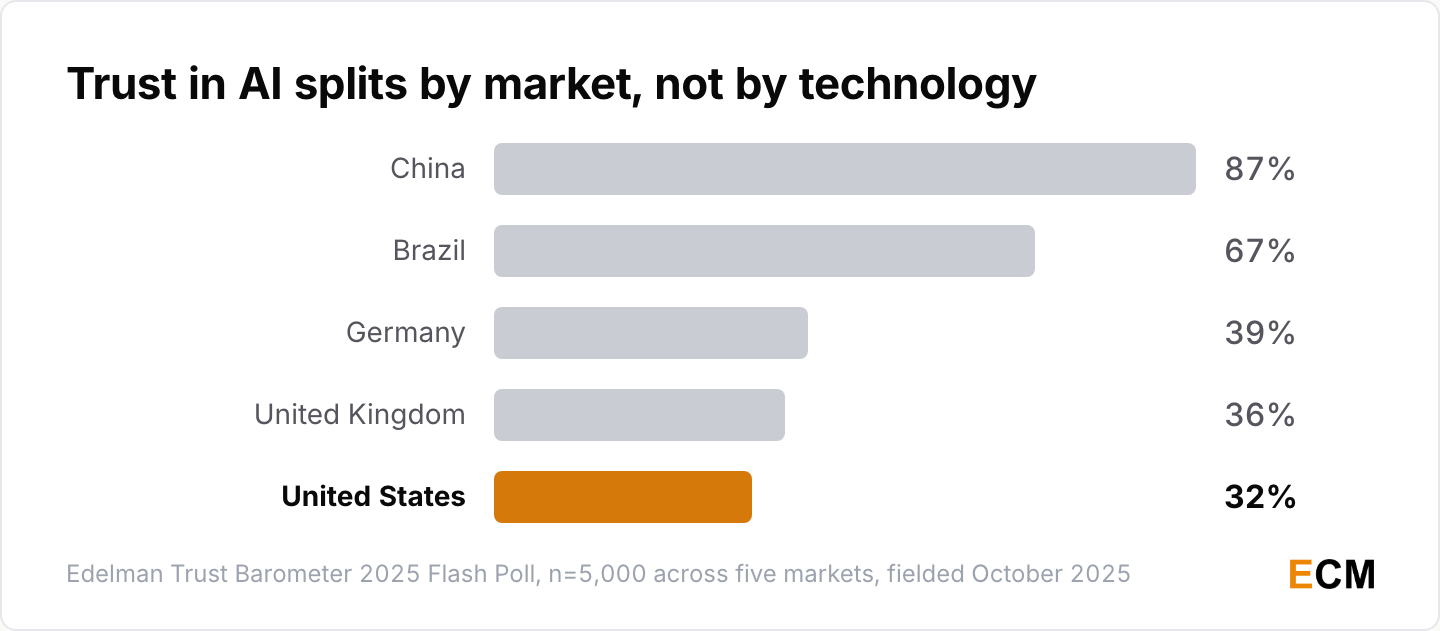
- Trust in AI runs 87% in China and 67% in Brazil (Edelman Trust Barometer 2025 Flash Poll, November 2025; n=5,000 across five markets, fielded October 17 to 27, 2025).
- It falls to 39% in Germany, 36% in the UK and 32% in the United States, the lowest of the five (Edelman, November 2025).
- In the United States 49% reject AI’s growing use against 17% who embrace it, while in China 54% embrace it and 10% reject it (Edelman, November 2025).
Edelman is a PR firm that advises corporations on AI communications, so it has a stake in this conversation being taken seriously. I would still use these numbers, because one instrument collected all five markets. Just do not quote a global average off a five-country poll.
What People See on Social Media
AI slop is now a phrase a survey can put in front of consumers and get a coherent answer to.
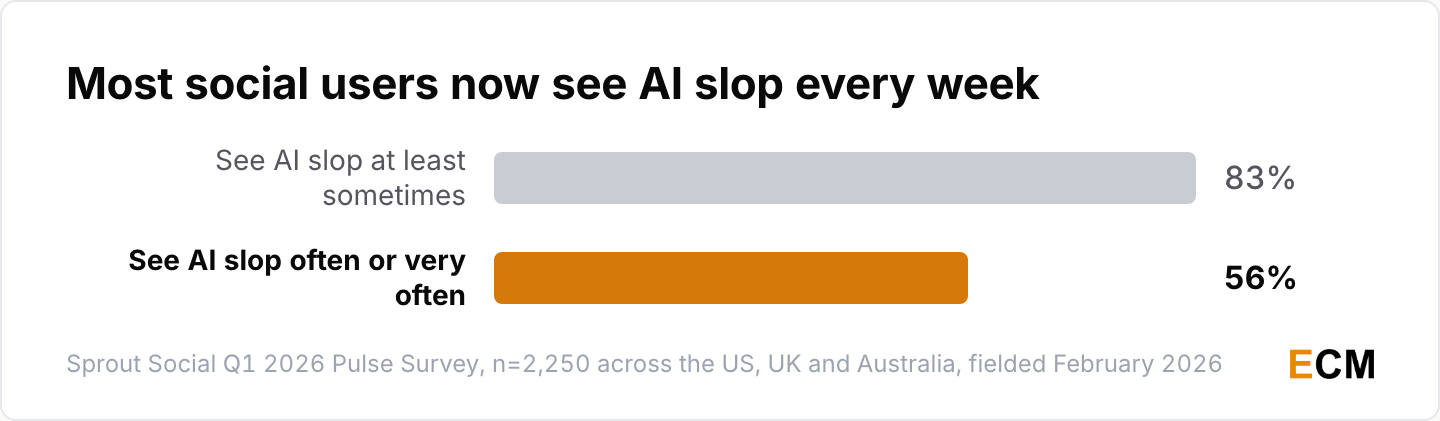
- 56% of social media users see AI slop often or very often, and 83% see it at least sometimes (Sprout Social Q1 2026 Pulse Survey, n=2,250 across the US, UK and Australia, fielded February 2026).
- Weekly generative AI use nearly doubled across six markets, from 18% in 2024 to 34% in 2025 (Reuters Institute, October 2025; YouGov, roughly 2,000 per market).
- ChatGPT reached 22% weekly use across those markets and 47% among 18 to 24-year-olds, with information-seeking overtaking media creation at 24% weekly (Reuters Institute, 2025).
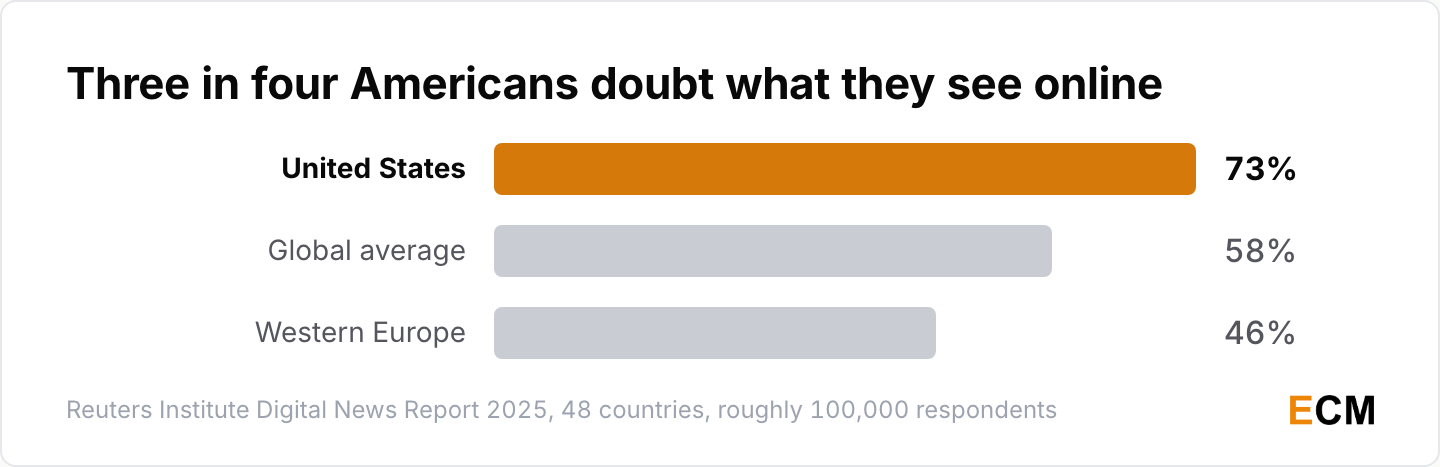
- 58% of people worldwide worry about telling real from fake online when it comes to news, rising to 73% in both the United States and Africa and falling to 46% in Western Europe (Reuters Institute Digital News Report 2025, 48 countries).
That is a reputational risk for any brand publishing generated imagery without saying so. The audience has a name for it now, and a majority reports running into it every week.
AI Copyright and Content Credentials Adoption
Two things a marketing team can act on here: what the courts have actually decided, and whether provenance tooling is real yet.
Content Credentials Adoption
Membership counts are not coverage counts, and the difference matters more than either number.
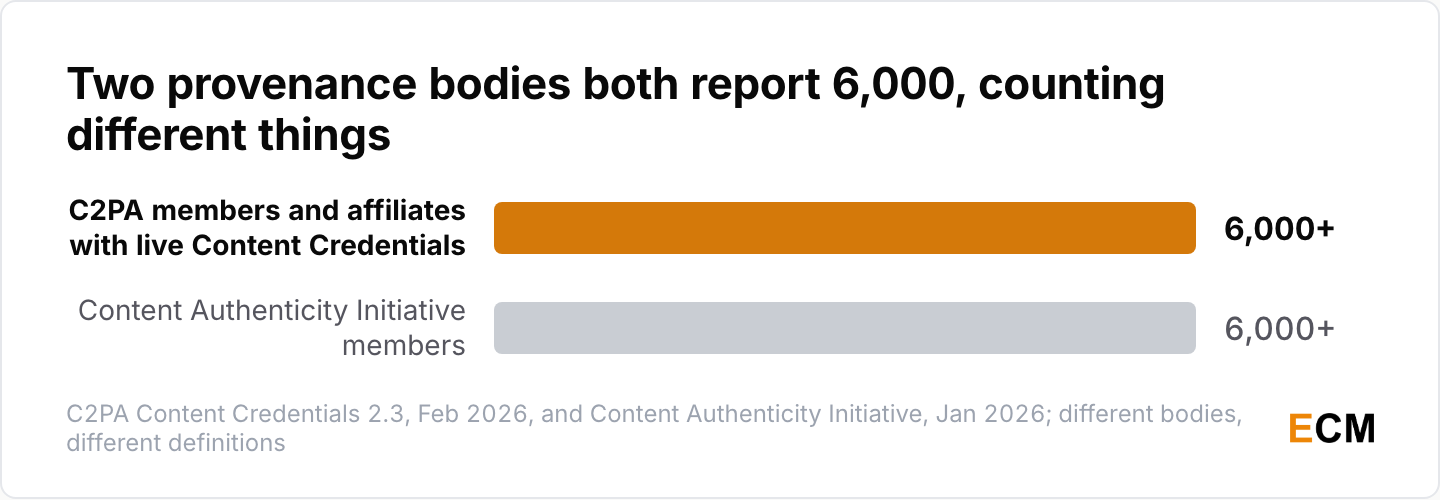
- The Content Authenticity Initiative passed 5,000 members in August 2025 (Content Authenticity Initiative, August 2025) and more than 6,000 by January 2026 (Content Authenticity Initiative, January 2026).
- More than 6,000 members and affiliates have live applications of Content Credentials as of the 2.3 release (C2PA, February 2026).
- Cloudflare became the first major content delivery network to implement Content Credentials, and roughly 20% of the web runs through Cloudflare (Content Authenticity Initiative, February 2025).
Both bodies now report more than 6,000, and neither figure is coverage. C2PA does not define what qualifies as a live application. The number worth wanting is the count of signed assets in circulation, and nobody publishes that in aggregate.
What the Getty Rulings Decided
The UK judgment is a great deal narrower than the headlines around it.
- Getty abandoned its primary copyright and database-rights claims during trial, and the secondary copyright claim failed because the court held that AI model weights are not an infringing copy (Getty Images v. Stability AI, EWHC 2863, November 4, 2025).
- Getty won a limited trade-mark finding under sections 10(1) and 10(2) of the Trade Marks Act and lost on section 10(3) (full judgment, November 2025).
- Stability admitted for the purposes of those proceedings that about 12.3 million of Getty’s images sit in LAION-2B-en, and the court expressly declined to make any finding on the number (judgment, November 2025).
- In the US case, Judge Trina L. Thompson granted in part and denied in part Stability’s motion to dismiss on April 23, 2026, with a jury trial set for January 18 to February 9, 2028 (CourtListener docket).
The UK court did not decide whether training a model on copyrighted images is itself infringement. Getty let that claim go because it could not establish the training happened in the UK. For a marketing team the posture is unchanged: keep a human in the review loop, record which model made each asset, and use Content Credentials where the tooling supports it.
Frequently Asked Questions
What Are the Most Important Visual Content Statistics for 2026?
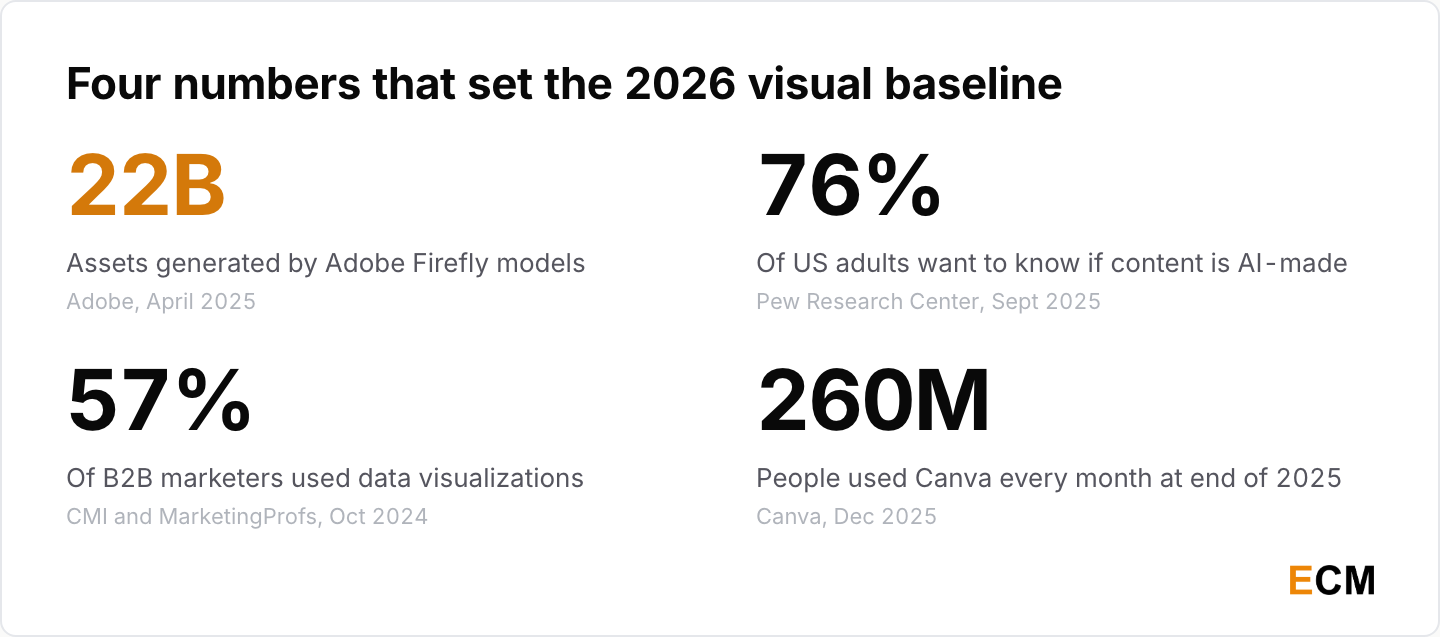
Four numbers cover supply, expectation, adoption and scale: Adobe Firefly’s 22 billion generated assets (Adobe, April 2025), Pew’s 76% wanting to tell AI from human work against 12% who think they could (Pew, September 2025), CMI’s 57% of B2B marketers using data visualizations (CMI, October 2024), and Canva’s 260 million monthly users (Canva, December 2025).
How Effective Is Visual Content in Marketing?
The strongest recent evidence is about video rather than static imagery. 58% of B2B marketers rate video their most effective format (CMI, n=980) and 48.6% name short-form video their highest-ROI type (HubSpot, n=1,500+). For still images, the best signal is Orbit Media’s finding that marketers using two to three visuals per post are the likeliest to report strong results (Orbit Media, n=1,042, 2026). That is self-reported correlation, so hold it loosely.
What Types of Visual Content Do Marketers Use Most?
Among B2B marketers, 57% used data visualizations or visual content in the prior 12 months, behind short articles at 92%, video at 76%, case studies at 75% and long articles at 69% (CMI and MarketingProfs, October 2024). Among marketers who quantified their own visual mix, 52.22% said charts and data visualizations were what they produced most often (Venngage, 2023).
How Does Visual Content Affect Social Media Engagement?
Carefully, because the engagement numbers everyone quotes are a decade old and predate the current algorithms. What is current is the downside: 56% of social users see AI slop often or very often and 83% see it at least sometimes (Sprout Social, n=2,250, February 2026). Generated imagery posted without disclosure now lands in a category the audience recognizes on sight.
How Does Visual Content Affect SEO and Website Performance?
No controlled study ties images to rankings. What exists is reading behavior and publishing practice: visitors have time for at most 28% of the words on a page (Nielsen Norman Group, 2008), and marketers who put two to three visuals in a post are the likeliest to report strong results (Orbit Media, n=1,042, 2026). Charts that carry information earn attention. Decorative stock imagery gets skipped.
Why Is Visual Content Important for Marketing?
Because attention on a page is short and disclosure expectations are rising at the same time. Readers have time for at most 28% of the words on a page and 20% is likelier (Nielsen Norman Group, 2008), and 76% of US adults want to know whether what they are looking at was made by AI (Pew Research Center, September 2025). Original visuals answer both.
How Many Marketers Use AI to Create Visuals?
55% of surveyed marketers use AI to generate charts, infographics and templates (Venngage, sample size not disclosed), and 53% of B2B marketers use creative asset tools to generate and edit images and video (CMI and MarketingProfs, n=1,015, October 2025). Those are not the same question and the samples are not comparable, so treat the pair as a range.
Do Consumers Want AI-Generated Images Labeled?
76% of US adults say it is extremely or very important to tell whether pictures, videos and text were made by AI or by people, while 12% feel confident they could tell on their own (Pew Research Center, n=5,023, fielded June 2025). Separately, 56% of social users report seeing AI slop often or very often (Sprout Social, n=2,250, 2026). Disclosure is cheaper than being caught.
Is “65% of People Are Visual Learners” True?
No. The figure goes back to a 2004 SSRN paper that asserts it without citing data (SSRN, 2004), and the learning-styles framework behind it is treated as a neuromyth in cognitive psychology. If you want a defensible version of the underlying idea, use John Medina’s hearing-plus-picture finding stated the way he states it (Brain Rules).
Related reading on this site. Video marketing statistics, content marketing statistics, digital marketing statistics, and reviews of Canva and Visme.
Written by
Editorial Staff
The Editorial Staff represents the writers, editors, and content creators who have worked (or work) at Elite Content Marketer. The experimenter-in-chief behind the team is Chintan Zalani, who has close to a decade of experience trying to make sense of the content marketing industry. Started in 2019, Elite Content Marketer is on a mission to help creators build sustainable businesses.
Related Articles

Marketing Data
58 AI Personalization Statistics for 2026: ROI + Adoption
58 AI personalization statistics for 2026: 78% of marketers can’t make enough personalized content, and 87% of brands rate it good while 29% of consumers agree.
Oct 2, 2026Read more →
Marketing Data
60 AI Workflow Automation Statistics for 2026
60 AI workflow automation statistics for 2026: 37% of respondents see any EBIT impact from AI, 6% are high performers, and agents scale at big firms.
Oct 1, 2026Read more →
Marketing Data
AI Image Generation Statistics 2026: 60 Data Points
60 AI image generation statistics for 2026: people now create more than 3 billion images a week with ChatGPT Images and OpenAI’s API.
Sep 30, 2026Read more →