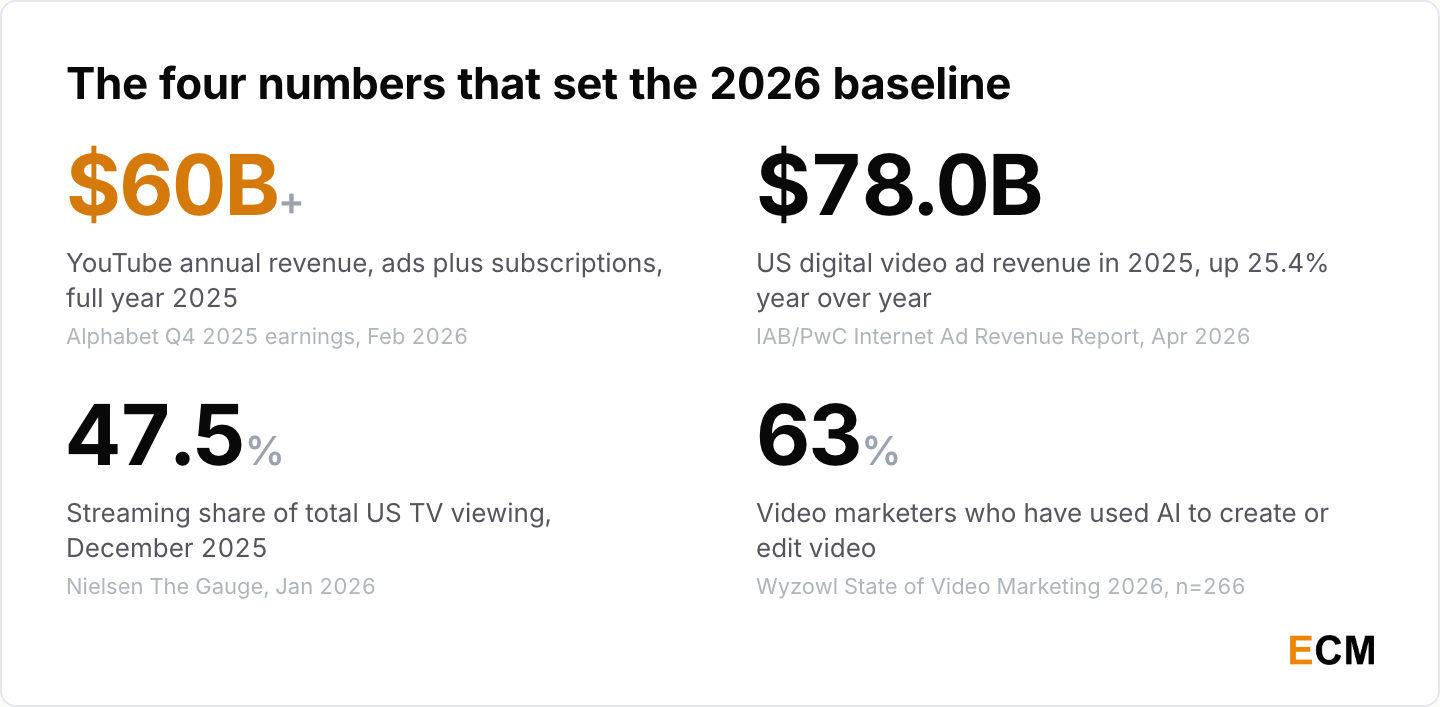
US digital video ad revenue grew 25.4% to $78.0 billion in 2025, faster than any other ad format (IAB/PwC, April 2026). These video marketing statistics show where that money went, and why marketer satisfaction fell while spending did not.
60 Video Marketing Statistics for 2026
 Written by Editorial Staff
Key Takeaways
- Video is the fastest-growing line in US digital advertising. Revenue reached $78.0 billion in 2025, up 25.4%, the strongest growth of any format IAB and PwC track (IAB/PwC, April 2026).
- Adoption has hit a ceiling and satisfaction has not. 91% of businesses use video, a joint all-time high, while the share reporting good ROI fell from 93% to 82% in a year (Wyzowl, 2026).
- Two independent 2026 surveys put AI video use at about two in three. Wyzowl has 63% of marketers, IAB has 62% of video ad buyers (Wyzowl, 2026; IAB, 2026).
- Streaming crossed 47.5% of US TV viewing in December 2025, an all-time high, and YouTube held 12.5% of TV in January 2026 on Nielsen’s distributor ranking (Nielsen, 2026; Nielsen, 2026).
- Short-form wins attention, long-form wins growth. Videos under one minute hold a 52% engagement rate while B2B videos over 20 minutes grew 420% in a year (Wistia, 2026; Vidyard, 2025).
- The most-quoted video statistic is no longer published. Cisco retired the forecast behind “82% of internet traffic will be video” and the nearest current report gives YouTube more than 10% of internet bandwidth instead (AppLogic Networks, 2025).
Video Marketing Adoption and ROI Statistics
Adoption stopped being the interesting question years ago. Where marketing strategies now differ is on what teams say video gives back, and the 2026 data on that is uncomfortable.
How Many Businesses Use Video
Nine in ten businesses now use video, six points above the 2020 reading and level with the all-time high.
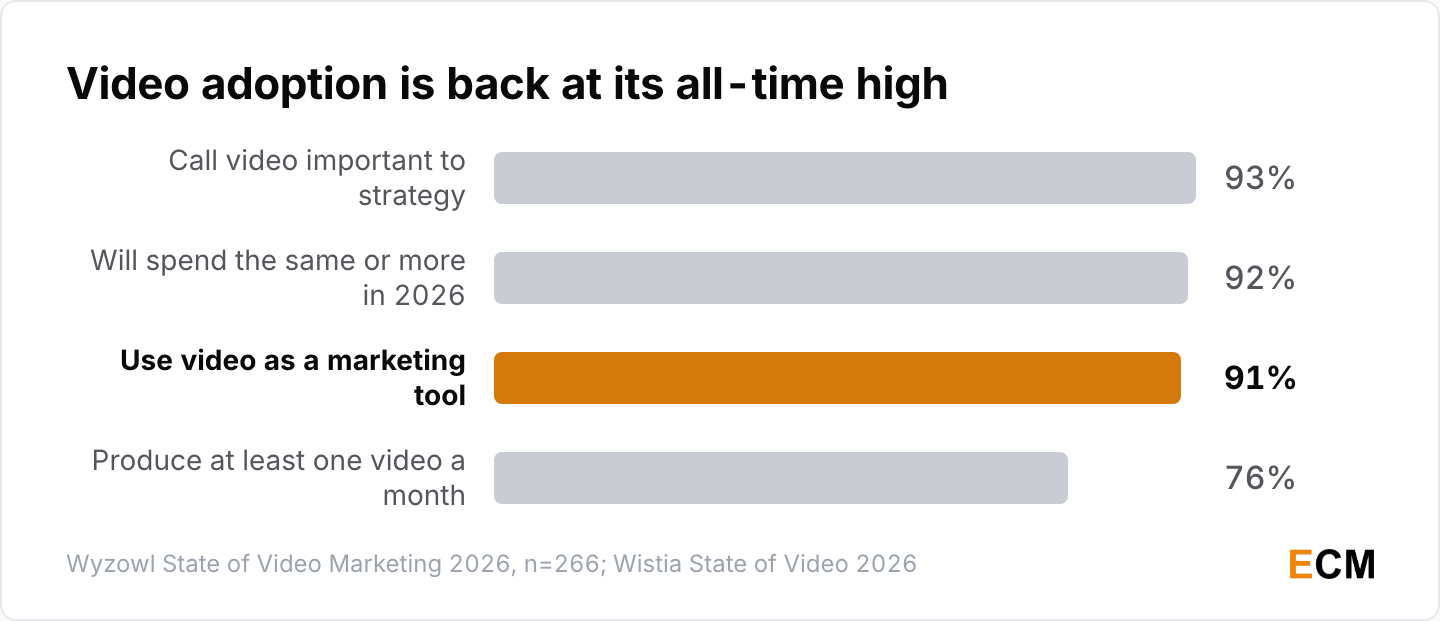
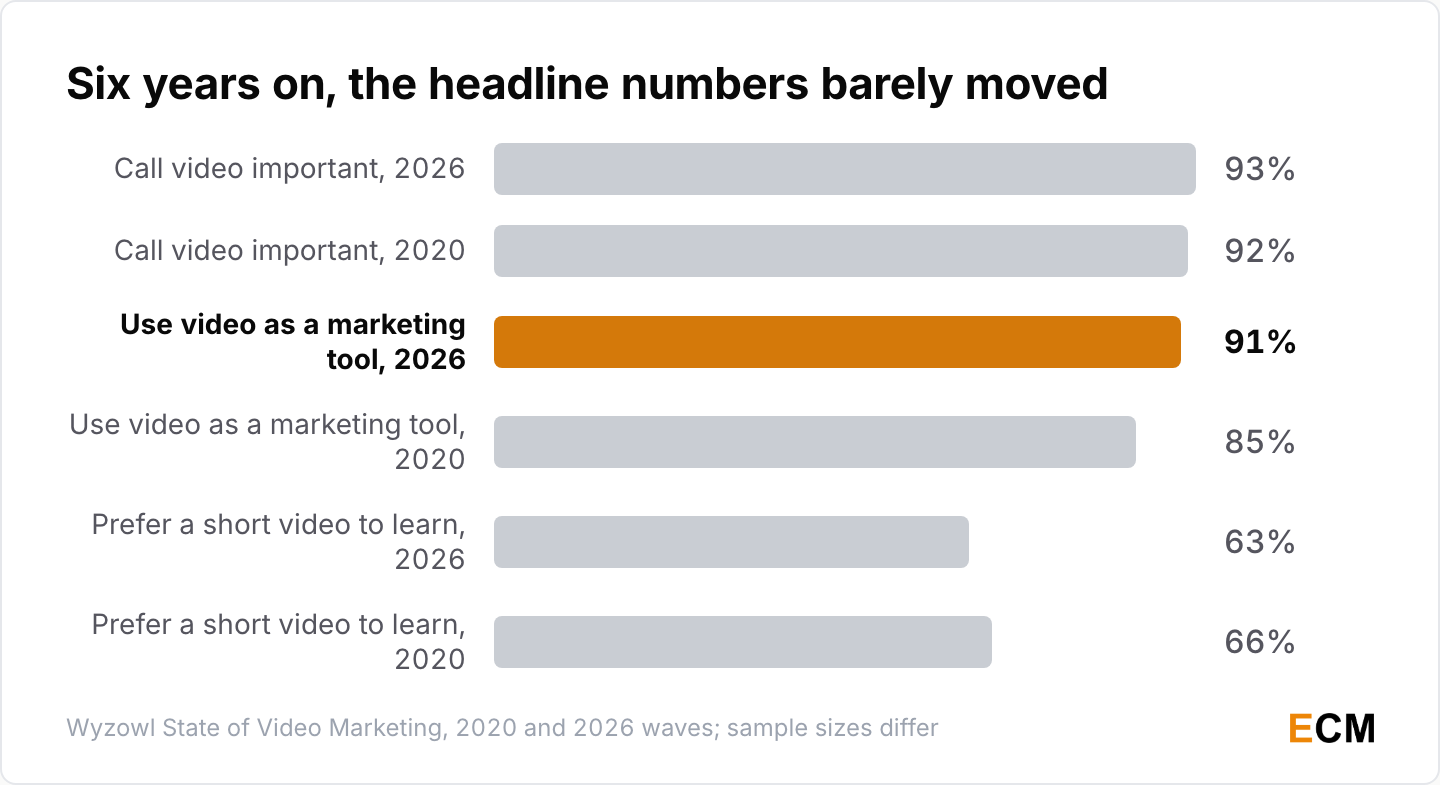
- 91% of businesses use video as a marketing tool in 2026, a joint all-time high, against 85% in the 2020 wave (Wyzowl State of Video Marketing 2026, n=266; Wyzowl 2020).
- 93% of video marketers call video an important part of their overall marketing strategy, a slight dip on the prior wave, and 92% plan to spend the same or more on video in 2026 (Wyzowl, 2026).
- 76% of teams produce at least one video a month (Wistia State of Video 2026, 900+ professionals surveyed plus 13M+ videos analyzed).
- 57% of teams spend more time creating video than promoting it, against 20% who spend more time promoting and 23% who split their time evenly (Wistia, 2026).
That last split is the most actionable number on this page. Production capacity is no longer the constraint for most teams. Distribution is, and most teams are still spending against the wrong side of it.
What Video Marketing ROI Looks Like
Reported return on investment fell eleven points in twelve months while spending intent held. I would not read that as video failing.
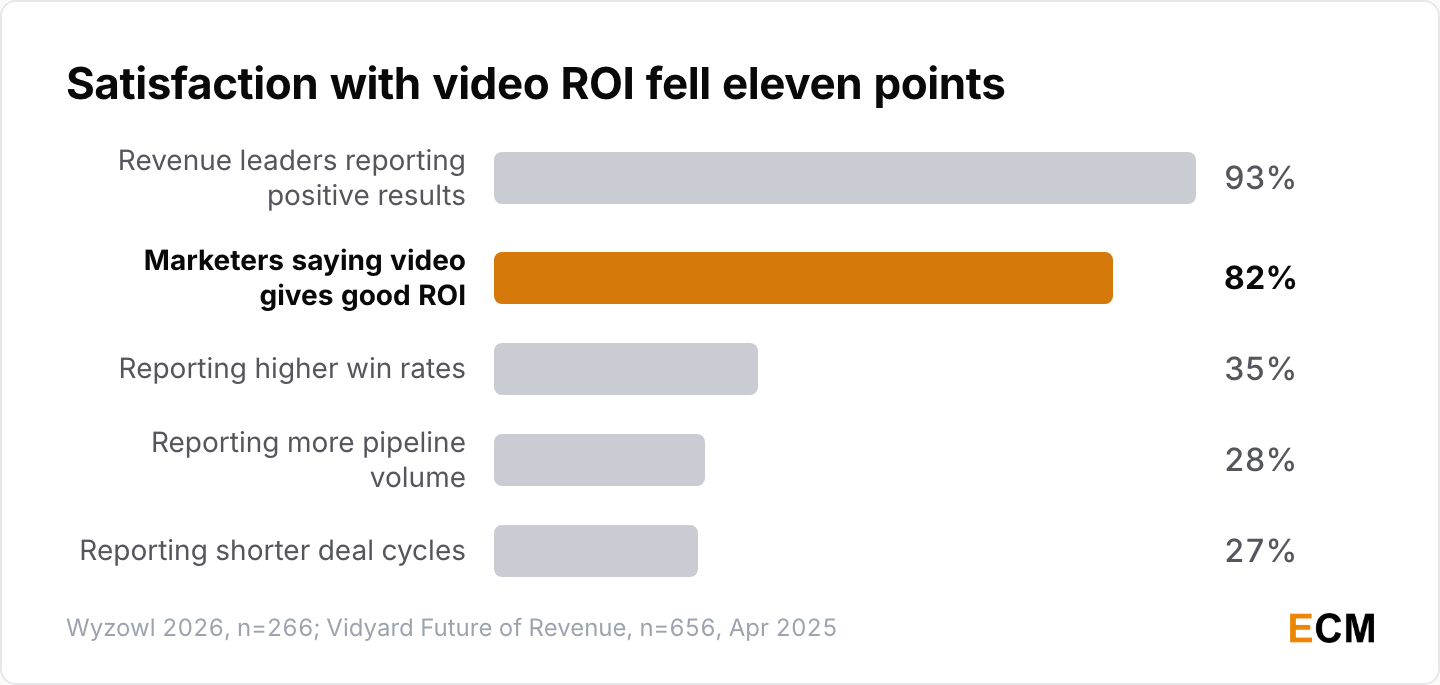
- 82% of marketers say video has given them good ROI, down from an all-time high of 93% in the prior wave (Wyzowl, 2026).
- 93% of revenue leaders using video report positive results including revenue impact, with 35% reporting higher win rates, 28% more pipeline volume and 27% shorter deal cycles (Vidyard, Future of Revenue, n=656 sales and marketing professionals, surveyed April 2025).
- 41% of marketers spent money on video ads in the past year, up from 36% in the prior wave (Wyzowl, 2026).
Those two ROI readings measure different things. Wyzowl asks marketers whether video felt worth it. Vidyard asks revenue leaders who had already bought a video platform. Neither is checked against booked revenue.
How Much Teams Spend on Video
Video budgets rarely take a majority of marketing spend, and a sizeable minority of teams cannot say what video content costs them.
- 46% of marketers give video a third or less of their marketing budget, and 17% do not track video spend at all (Wyzowl, 2026).
- Marketers split three ways on direction: 38% say video costs are rising, 32% see no change and 30% think costs are falling, while 48% of teams plan to raise video promotion budgets (Wyzowl, 2026; Wistia, 2026).
The 17% is the figure that undercuts every ROI number here. A sixth of the sample is reporting satisfaction with a return it cannot calculate.
Why Some Businesses Skip Video
Cost is not the whole story for the teams still sitting this out.
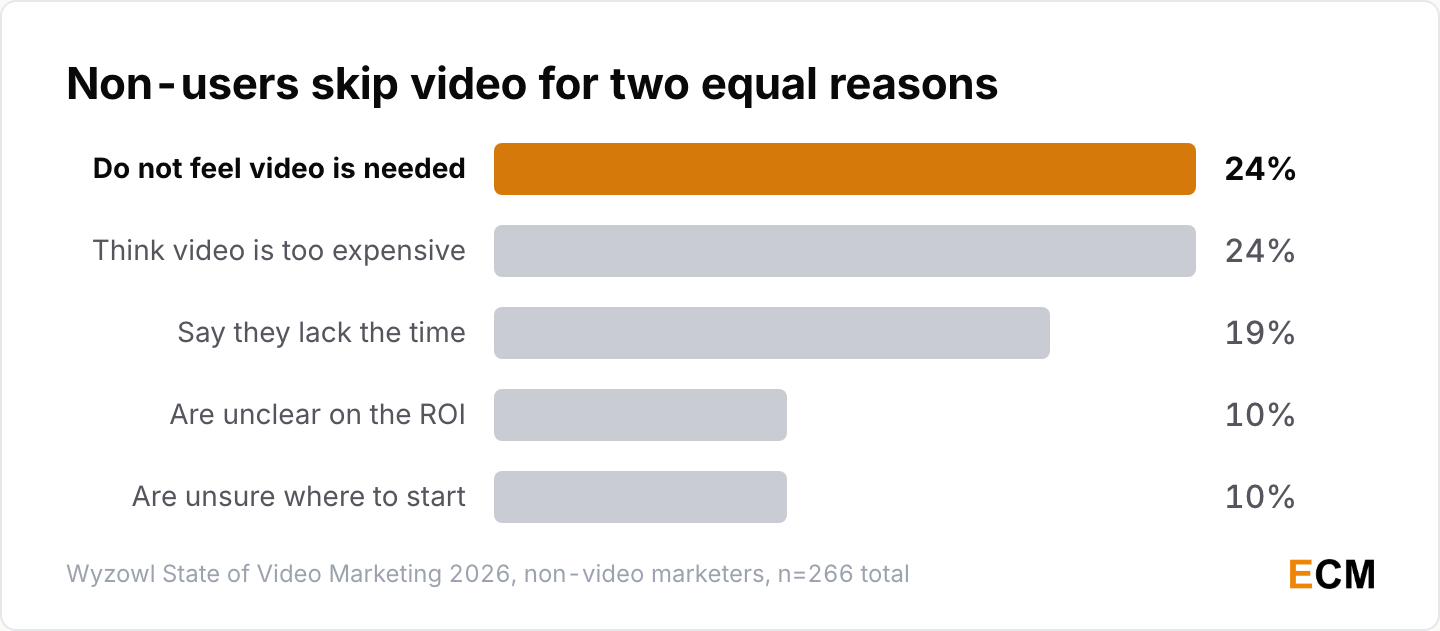
- Two reasons tie at the top for non-users at 24% each, not feeling video is needed and finding it too expensive, with 19% citing time and 10% each unclear on ROI or unsure where to start (Wyzowl, 2026).
- 67% of marketers who do not currently use video plan to start in 2026, down one point from the prior wave (Wyzowl, 2026).
Video Advertising and Connected TV Spend
This is the best instrumented money on the page. The two big sources disagree in a way that matters before you build video strategies on either.
US Digital Video Ad Spend
Digital video ad spend has roughly doubled in five years and now takes most of the TV and video pot.
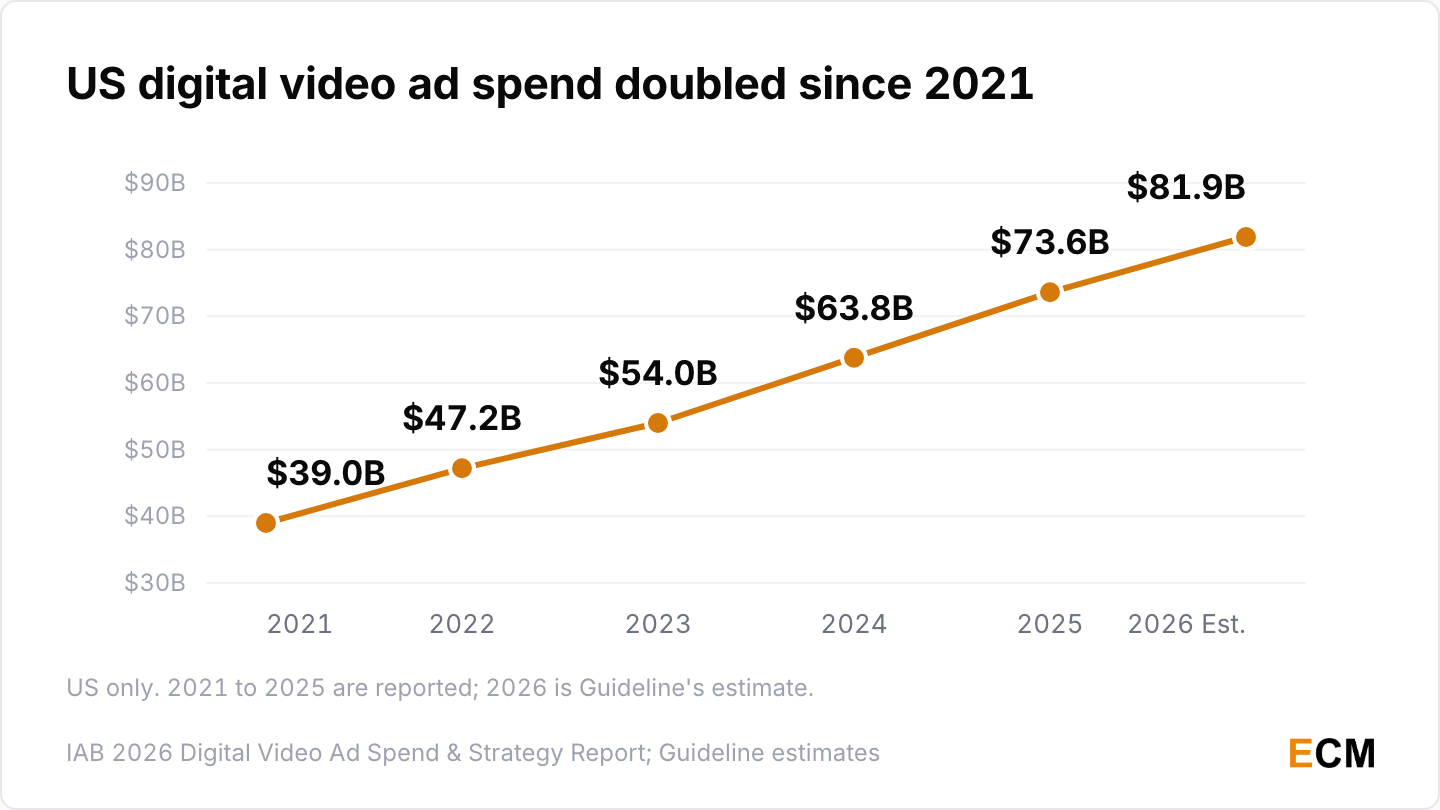
- US digital video ad spend reached $73.6 billion in 2025 and is projected at $81.9 billion in 2026, growth of 11% and roughly 20% faster than the total ad market (IAB 2026 Digital Video Ad Spend & Strategy Report, Part One; the dollar figures are Guideline’s estimates).
- The run before that was $39.0 billion in 2021, $47.2 billion in 2022, $54.0 billion in 2023 and $63.8 billion in 2024, the year digital video first outspent linear TV (IAB, 2026 report).
- Digital video took 58% of total US TV and video ad spend in 2025 and is projected at 61% in 2026, up from 38% in 2021 (IAB, 2026 report).
- The separate IAB and PwC census puts US digital video advertising revenue at $78.0 billion for 2025, up 25.4% and an increase of $15.8 billion in a single year (IAB/PwC Internet Advertising Revenue Report: Full Year 2025, April 2026; a voluntary survey of ad sellers, unaudited by PwC).
Those last two are the same year measured two ways. One counts revenue reported by ad sellers, the other is built from what buyers say they spent plus Guideline’s billing data. Quote whichever fits your question, name the method, and never average them.
Connected TV and Social Video Spend
Social video is now the bigger line, and CTV is no longer the preserve of large advertisers.
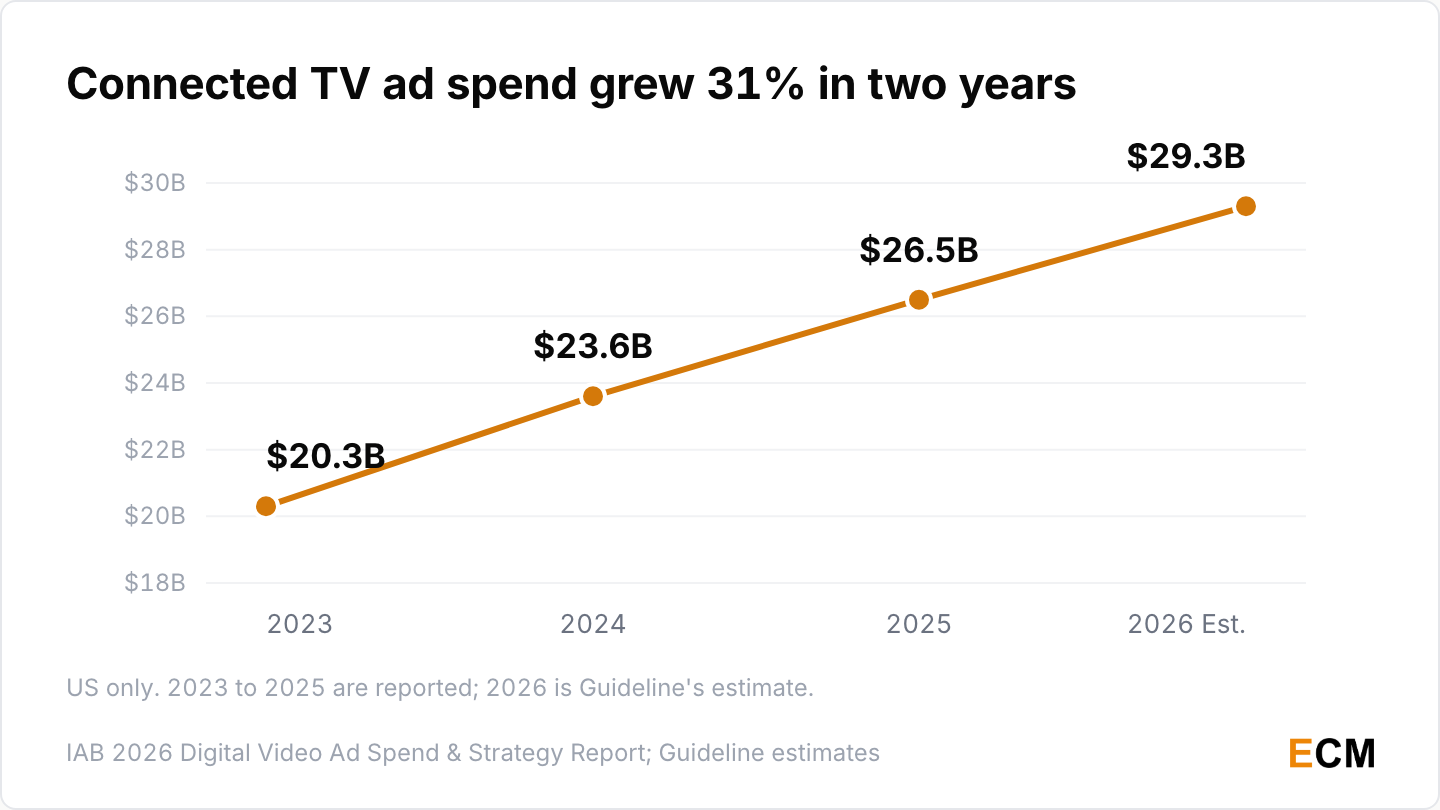
- Connected TV ad spend reached $26.5 billion in 2025 and is projected at $29.3 billion in 2026, up from $20.3 billion in 2023 and $23.6 billion in 2024 (IAB, 2026 report).
- Social video is the larger line at $28.2 billion in 2025 against CTV’s $26.5 billion, and is projected at $31.9 billion in 2026, with online video third at $18.9 billion (IAB, 2026 report).
- The share of small spenders buying CTV rose from 60% in 2024 to 85% in 2026 as self-serve platforms lowered the entry barrier (IAB, 2026 report).
- US creator-economy advertising spend was projected at $37 billion in 2025 and $44 billion in 2026 (IAB 2025 Creator Economy Ad Spend & Strategy Report, published November 2025).
Where Connected TV Budget Comes From
Only a minority of buyers raising CTV spend are funding it with new money.
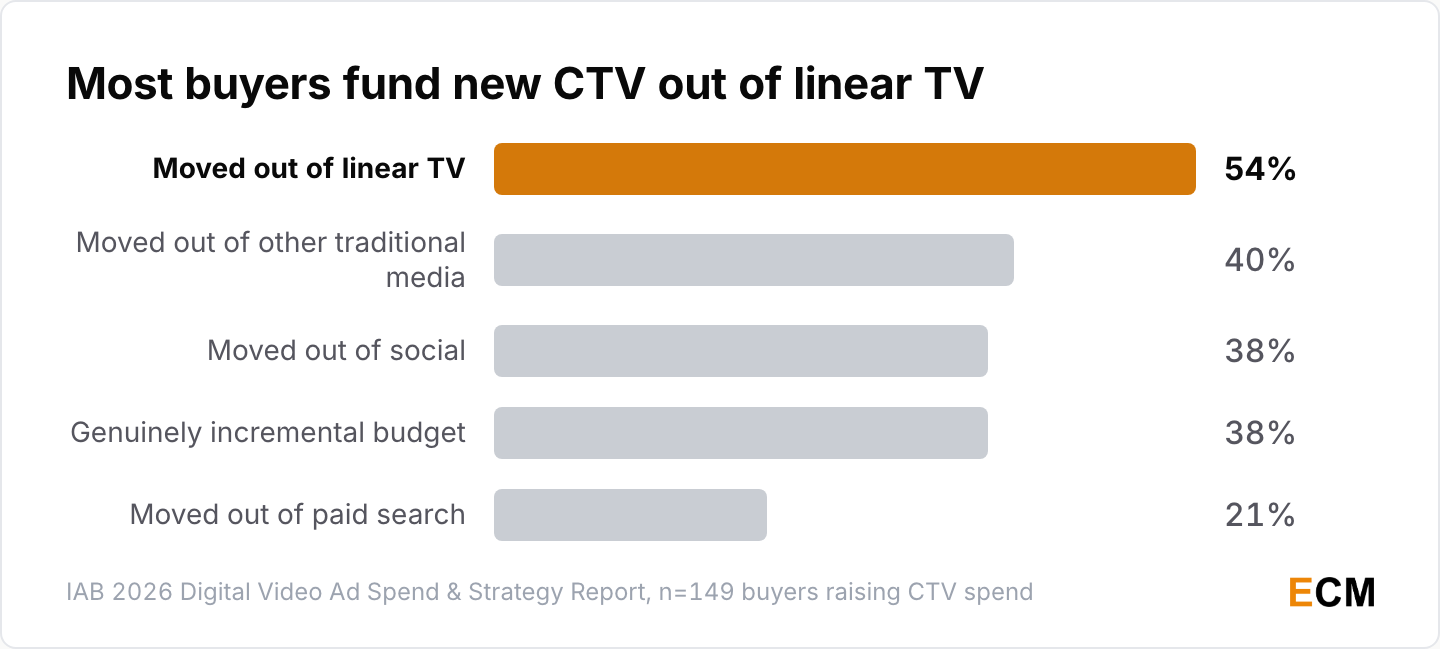
- Among buyers increasing CTV spend in 2026, 54% fund it out of linear TV and 40% out of other traditional media such as print and radio (IAB, 2026 report, n=149 buyers raising CTV spend).
- Another 38% take it out of social, 38% call it genuinely incremental budget and 21% pull it out of paid search (IAB, 2026 report).
That is the number that should change a media plan. Most buyers raising CTV spend are moving budget rather than adding it. If you own the social line, this is where it goes.
The Most Effective Video Marketing Platforms
Video marketing channels are where opinion and measured behavior split. They agree on the top platform and disagree about almost everything below it.
Which Platforms Marketers Rate Most Effective
YouTube leads by a wide margin, and TikTok sits where most roundups will not put it.
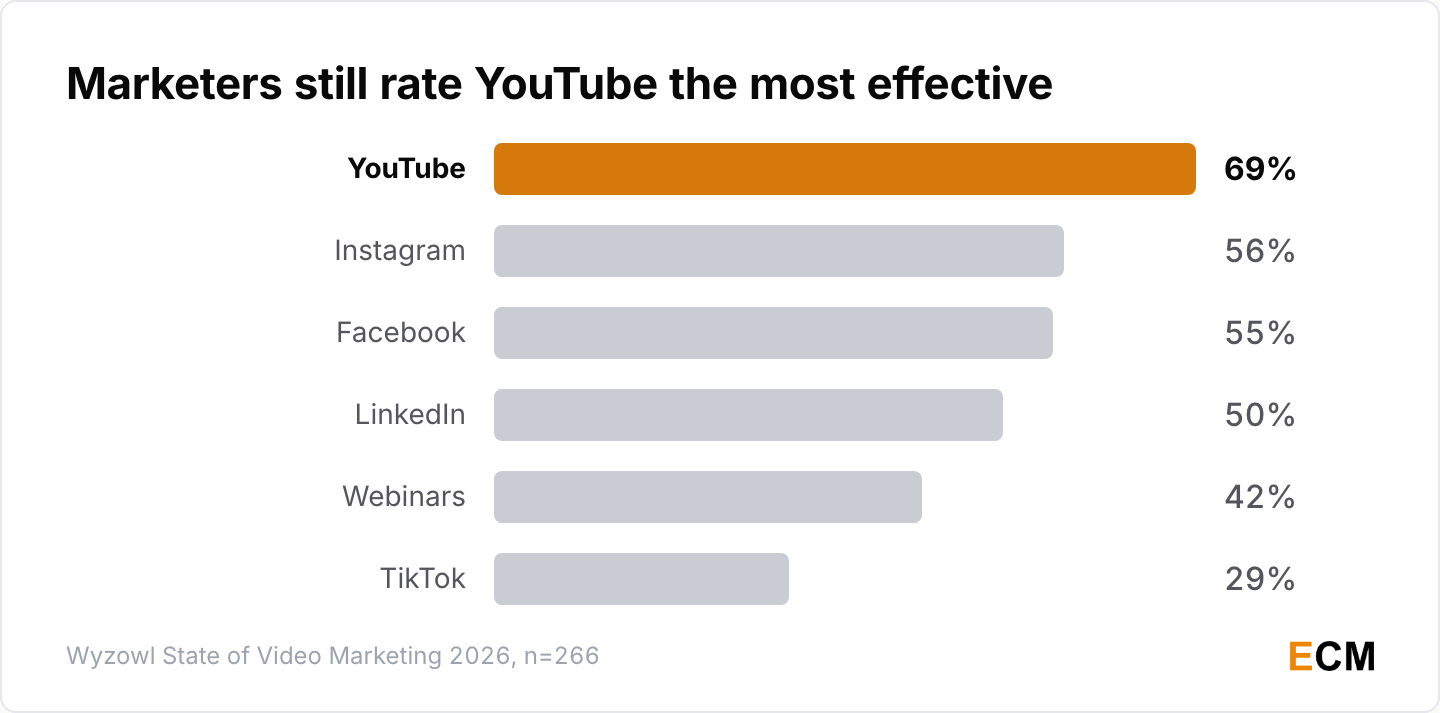
- Marketers rate YouTube the most effective video platform at 69%, then Instagram at 56%, Facebook at 55%, LinkedIn at 50% and webinars at 42% (Wyzowl, 2026).
- TikTok ranks below all of them at 29%, which Wyzowl files under least effective alongside interactive video at 20% and X at 16% (Wyzowl, 2026).
How YouTube Counts Reach and Revenue
YouTube’s own numbers are large and mostly self-reported, and the way it counts a view has changed twice.
- YouTube’s annual revenue passed $60 billion across ads and subscriptions in 2025, the first figure Alphabet has given on a fiscal-year basis after a $50 billion trailing-four-quarter total in October 2024, with Q4 2025 ad revenue at $11.38 billion against $10.47 billion a year earlier (Alphabet Q4 2025 earnings call, February 4, 2026; earnings slides).
- YouTube ad revenue grew 13% year over year in Q2 2026, the most recent quarter Alphabet has reported, and Alphabet counted more than 325 million paid consumer subscriptions in Q4 2025, reaching 350 million by Q1 2026 (Alphabet Q2 2026, Q4 2025 and Q1 2026 earnings; company-reported).
- YouTube Shorts averages more than 200 billion daily views and more than 1 billion hours of YouTube are watched on TV screens every day, both self-reported with no third-party audit (Neal Mohan, Cannes Lions, June 2025).
- YouTube began counting a Shorts view at the start of playback in March 2025, with the stricter measure surviving as engaged views, and extends the same rule to long-form video and live streams on August 24, 2026 (TeamYouTube, March 2025; YouTube Help).
Any Shorts comparison that straddles March 2025 is measuring two different things, and from late August 2026 the same caveat applies to long-form view counts.
For the platform-level detail behind these I keep a separate YouTube statistics roundup, a practical companion on promoting a YouTube channel, and a guide to making money on YouTube.
How Streaming Split the TV Screen
Streaming set a record share of US TV viewing, and YouTube beats every media company on the same panel.
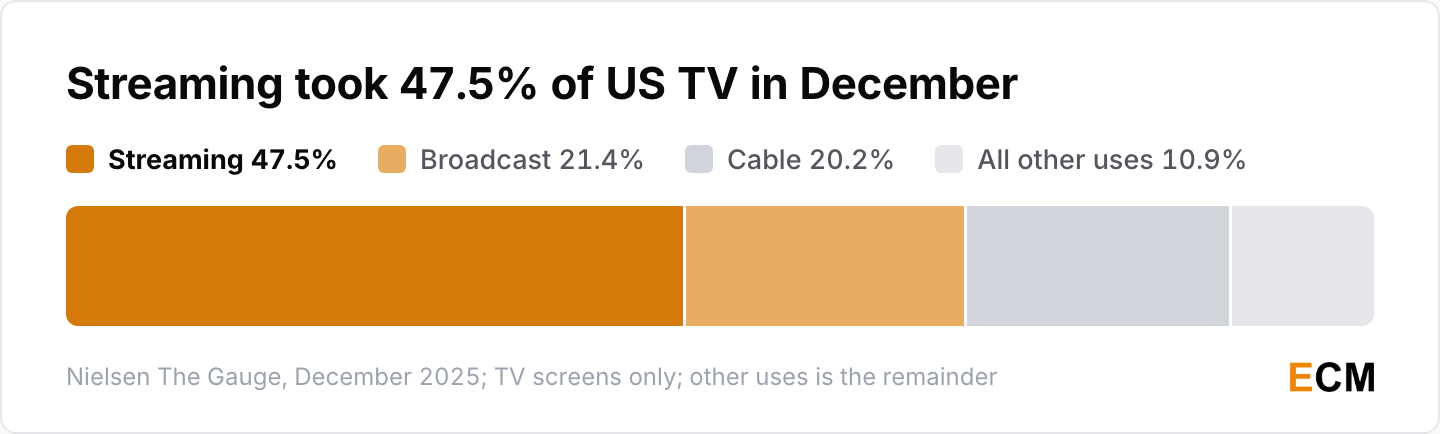
- Streaming reached 47.5% of total US TV usage in December 2025, an all-time high, against 21.4% for broadcast and 20.2% for cable, which leaves 10.9% of the set for everything else (Nielsen The Gauge, released January 2026).
- Netflix took 9.0% of all US TV use that month and Prime Video 4.3%, both platform-best shares, and streaming took 54% of TV on Christmas Day 2025, the largest single-day share recorded (Nielsen The Gauge, January 2026).
- The streaming services behind that share now lead with ad reach rather than subscribers: Netflix’s ad tier passed 250 million monthly active viewers by May 2026 (Netflix, 2026) on 2025 ad revenue above $1.5 billion (Netflix Q4 2025 shareholder letter, 2026), Disney+ ended the September 2025 quarter at 131.6 million subscribers and Disney has not disclosed the number since (Disney, November 2025) and Roku passed 100 million streaming households in April 2026 (Roku, April 2026).
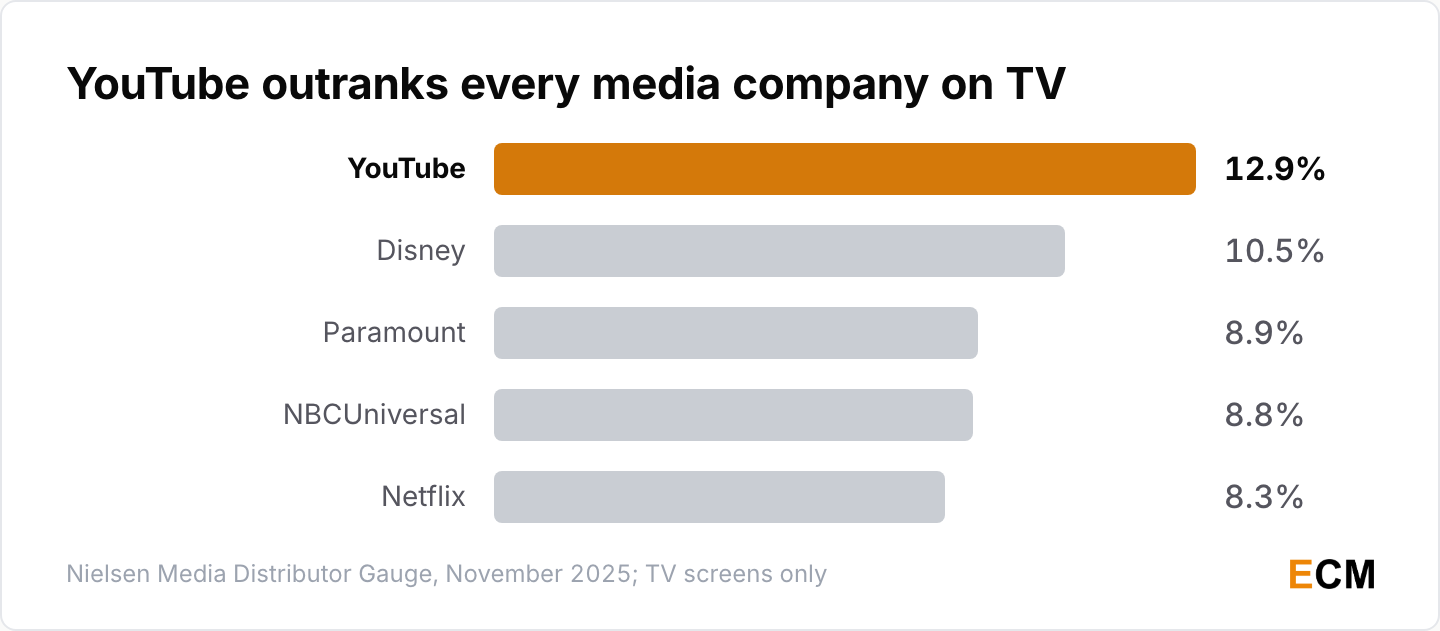
- On the Media Distributor Gauge, the separate ranking that rolls the same viewing up by parent company, YouTube held 12.9% of TV in November 2025, ahead of Disney at 10.5%, Paramount at 8.9%, NBCUniversal at 8.8% and Netflix at 8.3% (Nielsen, 2025).
- YouTube still led in January 2026 at 12.5%, ahead of Disney at 11.9% and of every individual streaming service (Nielsen Media Distributor Gauge, 2026).
Nielsen measures TV screens only. Mobile and tablet viewing, where most Shorts and TikTok consumption happens, sits outside the panel. For living-room behavior it is the cleanest source here, and for total video attention it undercounts short-form badly.
What Meta and TikTok Disclose
Both companies publish far less than the roundups imply, and the gap matters before you quote either.
- Instagram Reels watch time grew more than 30% year over year in the US in Q4 2025, and Facebook video time grew at a double-digit rate in the US in the same quarter (Meta Q4 2025 earnings call, January 2026).
- Meta’s Family daily active people averaged 3.58 billion in December 2025, up 7%, and 3.60 billion in June 2026, up 3%, on Meta’s own defined metric rather than a headcount of individuals (Meta Q4 2025 and Q2 2026 results).
- ByteDance FY2024 revenue was roughly $155 billion, up 29%, with international revenue mostly from TikTok at about $39 billion, and overseas revenue grew nearly 50% in 2025 (Bloomberg, April 2025; Chinese business press, April 2026; both journalist-reported from figures ByteDance has never confirmed).
Meta does not break out Reels ad revenue, Reels daily users or global Reels watch time, and ByteDance publishes nothing at all. If a roundup hands you a precise TikTok watch-time figure for 2026, ask where it came from.
AI in Video Marketing Statistics
Three surveys give three different AI adoption numbers, and all three are correct under their own definitions.
How Many Marketers Use AI for Video
Two 2026 surveys of completely different populations land a point apart, which is the interesting result.
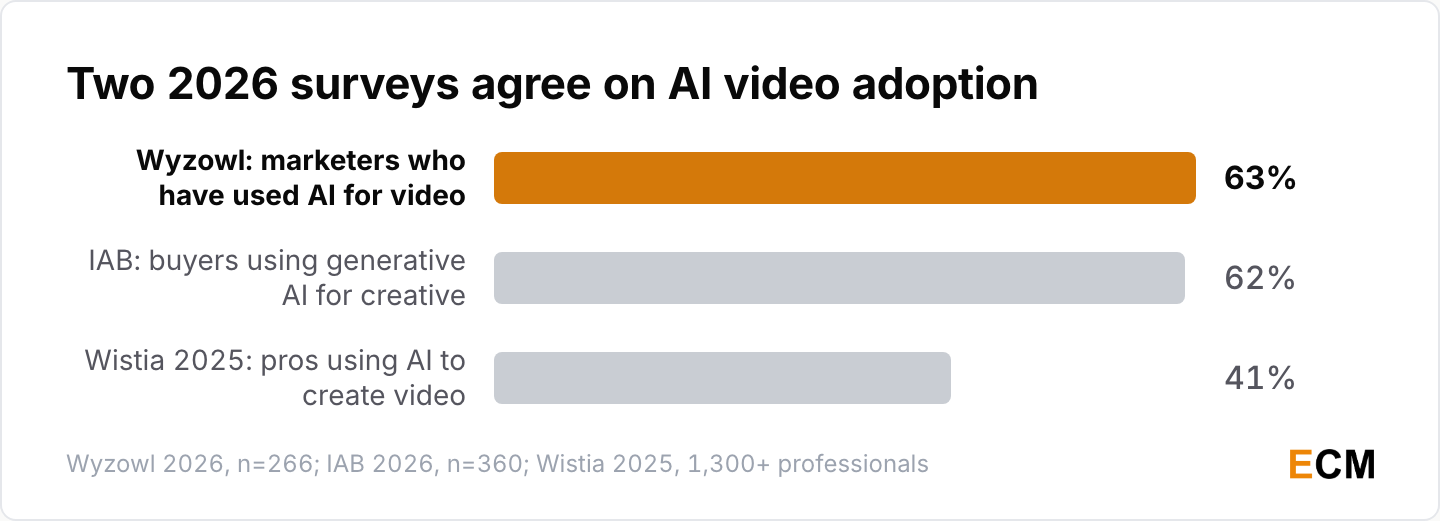
- 63% of video marketers say they have used AI tools to help create or edit marketing videos, up from 51% a year earlier (Wyzowl State of Video Marketing 2026, n=266, fielded late 2025).
- 62% of US video ad buyers use generative AI to build or enhance digital video creative, up from 51% a year earlier (IAB 2026 full report, n=360; the IAB summary calls it nearly two in three).
- 41% of brands reported using AI to create videos in Wistia’s 2025 survey, up from 18% the year before, and the 2026 edition reports more than a third of teams using AI with nearly a quarter more planning to start (Wistia 2025; Wistia 2026).
Wyzowl asked marketers broadly whether they had ever used AI on any marketing video. IAB asked large video ad buyers about generative AI in current ad creative. Wistia asked its own customers about AI inside a production workflow.
Two 2026 surveys converging from completely different populations is what makes roughly two in three the number I would defend in a meeting.
What Buyers Use Generative AI For
Among the buyers who use it, generative AI is already touching a third of their video creative.
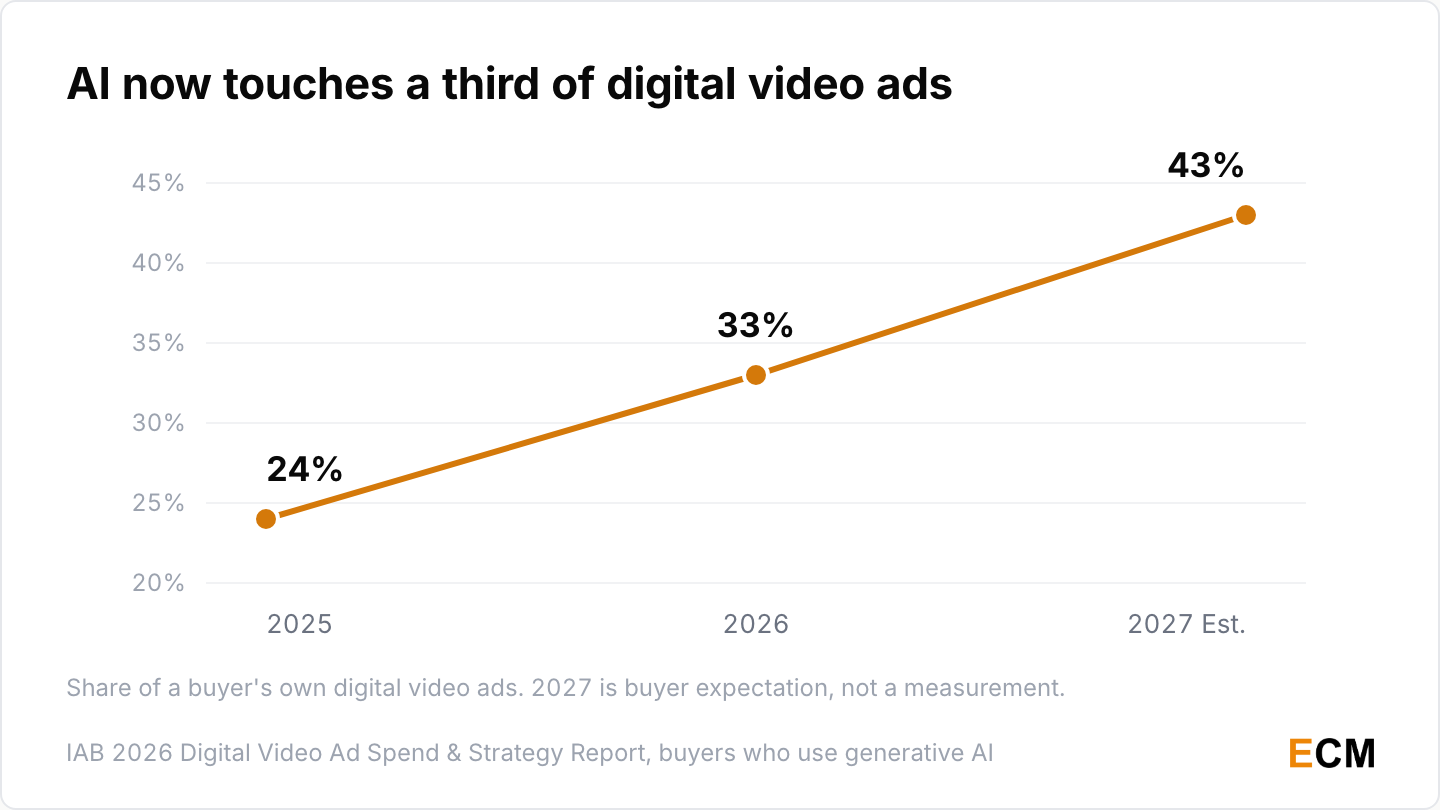
- Generative AI touched 33% of these buyers’ digital video ads in 2026, up from 24% in 2025, and they expect 43% by 2027 (IAB, 2026 report; IAB summary).
- Large spenders are well ahead: 70% of buyers spending over $50 million a year use generative AI for creative enhancements, against 54% of those below that line (IAB, 2026 report, page 31).
IAB’s own note is that usage was roughly even across company sizes a year ago, so this is a gap opening rather than a reversal. The 43% is an expectation, and expectations in ad-buying surveys convert at well under 100%.
How Fast AI Video Tools Turn Over
Money is pouring in while products still disappear inside a year, which should shape any tooling decision.
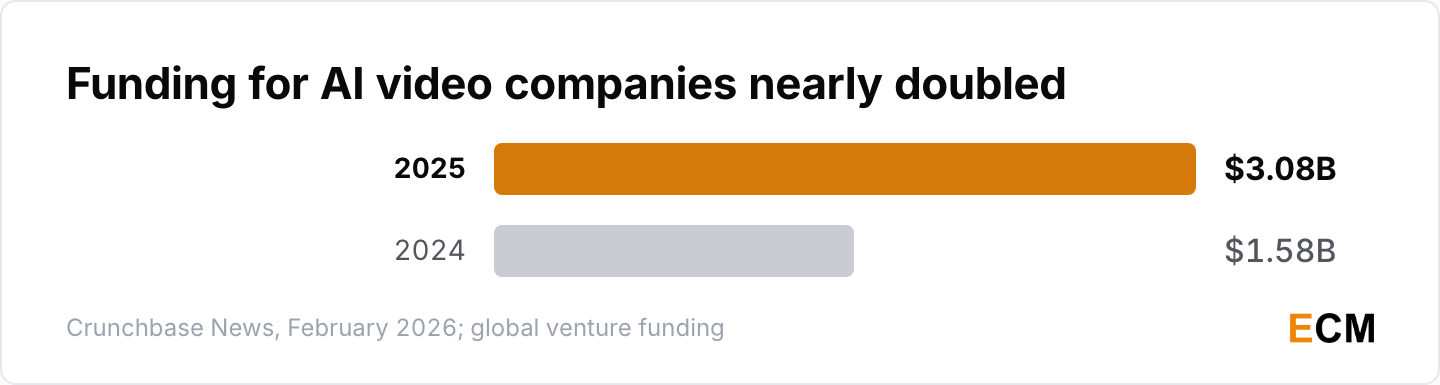
- Global funding for AI-related video companies reached $3.08 billion in 2025, against $1.58 billion in 2024, a 94.6% rise on Crunchbase’s unrounded totals (Crunchbase News, February 2026).
- Runway raised a $315 million Series E at a $5.3 billion valuation in February 2026, and Synthesia closed a $200 million Series E at a $4 billion valuation in January 2026 (Crunchbase News, 2026; Synthesia, company-disclosed).
- Third-party reconstructions put Synthesia near $146 million ARR in September 2025 and HeyGen at $205 million in June 2026, up from $123 million at the end of 2025 (Sacra on Synthesia and Sacra on HeyGen; estimates, not audited).
- OpenAI’s Sora passed 1 million iOS downloads in under five days after its September 2025 launch (CNBC, 2025, reporting OpenAI’s own count), peaked at about 3.33 million downloads across the App Store and Google Play in November 2025 (TechCrunch citing Appfigures, 2026), and was discontinued on April 26, 2026 (OpenAI Help Center).
Just under seven months from launch to retired product. That is the number I would put next to any AI video tooling decision that assumes a vendor will still be there in two years.
If you are evaluating the surviving tools, the pages for Synthesia, HeyGen and Runway cover what each one is built for and where its pricing starts.
Video Length, Format and Production Statistics
Adoption numbers say almost everyone makes video. These say which type of video content teams make, how long it runs, and what video creation costs them.
The Most Popular Types of Video
Social video has just overtaken the explainer as the most-made video format, and testimonial video is growing fastest.
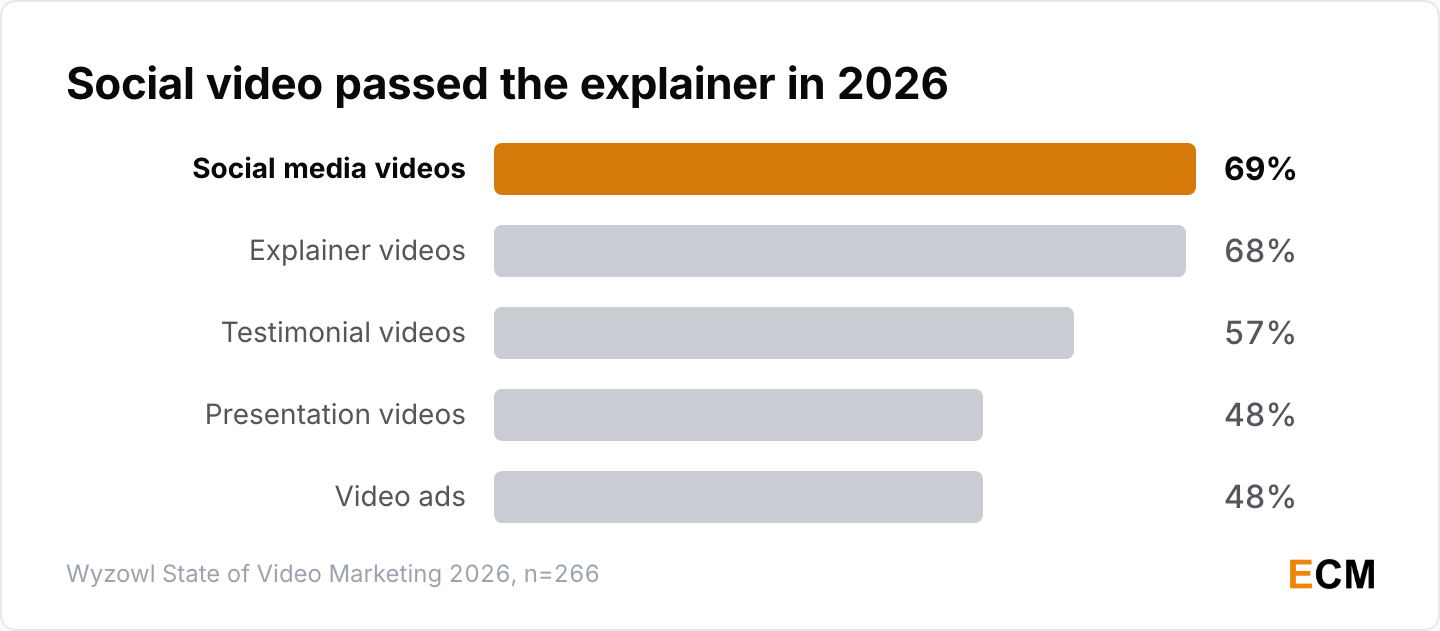
- Social media videos are the most-created type in 2026 at 69% of video marketers, followed by explainers at 68%, testimonials at 57%, presentations at 48% and video ads at 48% (Wyzowl, 2026).
- Live action is the dominant production style, with 51% of video marketers mostly creating it against 23% for animated video and 19% for screen recordings (Wyzowl, 2026).
- Customer testimonial videos are planned by 47% of companies in 2026, up from 38% in 2025, 37% in 2024 and 17% in 2023 (Wistia, 2026).
Explainer video is the one worth noticing. It has sat near the top of this list for a decade, and it is the only format on it that survived the shift to vertical without changing shape.
How Long a Marketing Video Should Be
Marketer opinion and hosting-platform data broadly agree on short-form video, and the exception sits in B2B.
- 71% of marketers believe videos between 30 seconds and 2 minutes are the most effective length (Wyzowl, 2026).
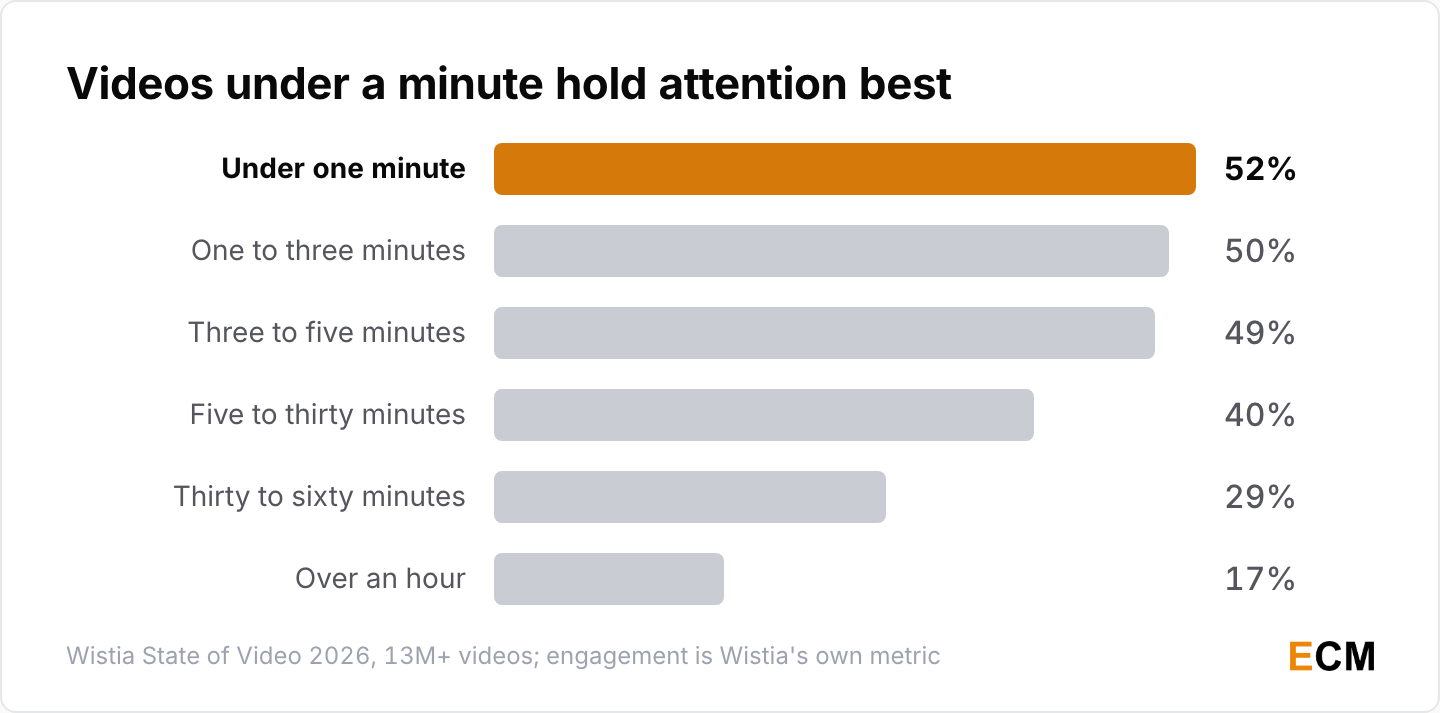
- Videos under one minute recorded a 52% average engagement rate, easing to 50% at one to three minutes and 49% at three to five, then falling to 17% past an hour (Wistia State of Video 2026, 13M+ videos analyzed).
Long-Form Video Growth in B2B
The opposite trend runs through B2B sales and demand generation, and the two are not in conflict.
- Vidyard users created 420% more videos over 20 minutes in 2024, while videos under three minutes grew about 30% (Vidyard 2025 Video in Business Benchmark Report, from the 943,305 videos its users created in 2024).
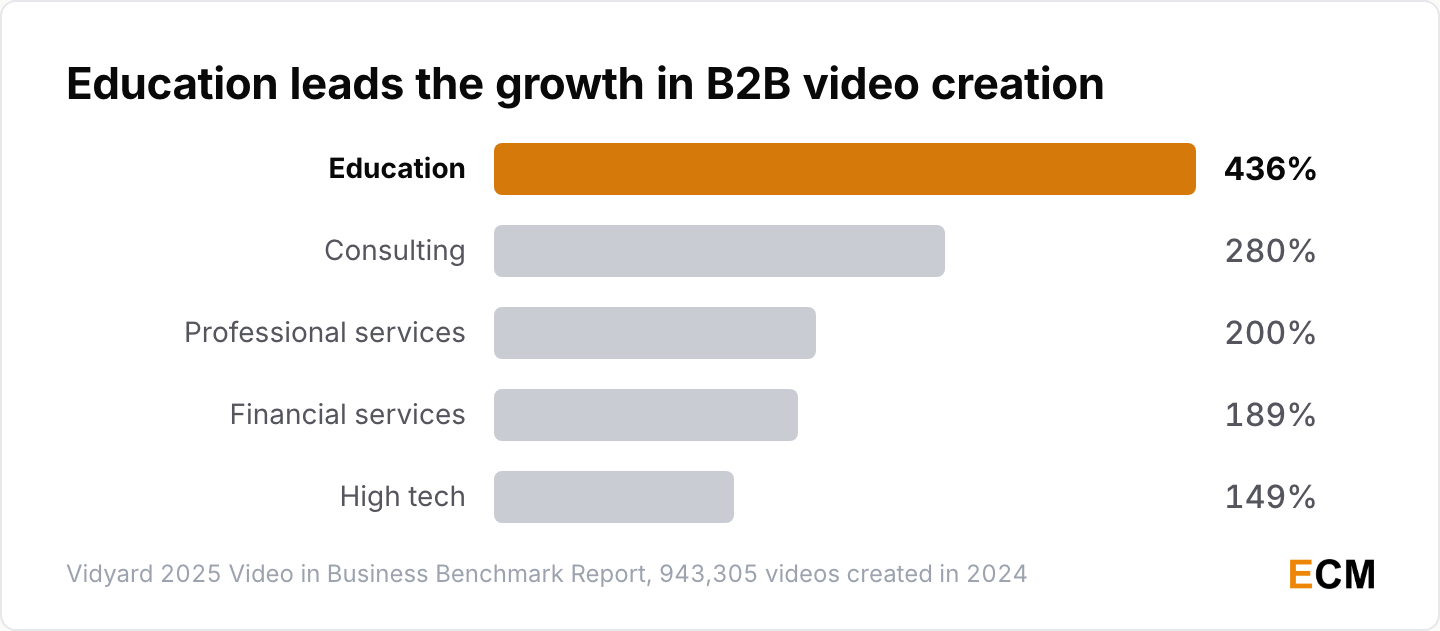
- Education companies created 436% more videos in 2024 than in 2023, consulting 280% more, professional services 200%, financial services 189% and high tech 149% (Vidyard, 2025 report).
Short-form wins the engagement rate and long-form wins the growth rate. One is a per-video attention metric on a hosting platform, the other is a creation-volume curve in B2B. If you run webinars, the same split shows up in the webinar statistics I track separately.
How Teams Make Video and What It Costs
Most video is made in house, and where teams share it has shifted away from where they rate it.
- 59% of businesses create their video content entirely in house, 10% use external vendors exclusively and 32% use a mix of both (Wyzowl, 2026).
- 81% of teams share videos on LinkedIn against 76% on YouTube, and vertical HD video uploads at 1080×1920 grew 24% year over year (Wistia, 2026).
Wistia reports separately that eight in ten teams call LinkedIn their primary place to share video. That is an all-teams split rather than a B2B-only cut, which is why it sits oddly against the effectiveness ranking above.
Consumer Video Behavior and Viewing Trends
Consumer behavior is where video marketing trends get tested. What people say they want and what measured panels show them doing are two different datasets, and only one is a probability sample.
What Consumers Say They Want
The consumer half of Wyzowl’s panel is thin, so read these brand video preferences as direction rather than measurement.
- 84% of consumers want to see more videos from brands in 2026, and 89% say video quality affects their trust in a brand, down from 91% the prior year (Wyzowl, 2026).
- 63% of consumers say they would most like to watch a short video to learn about a product or service, against 12% who prefer a text article, 7% an infographic, 5% a sales call and 4% a webinar (Wyzowl, 2026).
- The same preference read 66% against 18% for a text article in the 2020 wave, when the sample was 656 respondents against 266 today, and no panel provider or margin of error is disclosed in either (Wyzowl 2020; Wyzowl 2026).
How US Teens Watch Video
Pew’s is the only probability-based sample on this page, which makes these the sturdiest consumer numbers here.
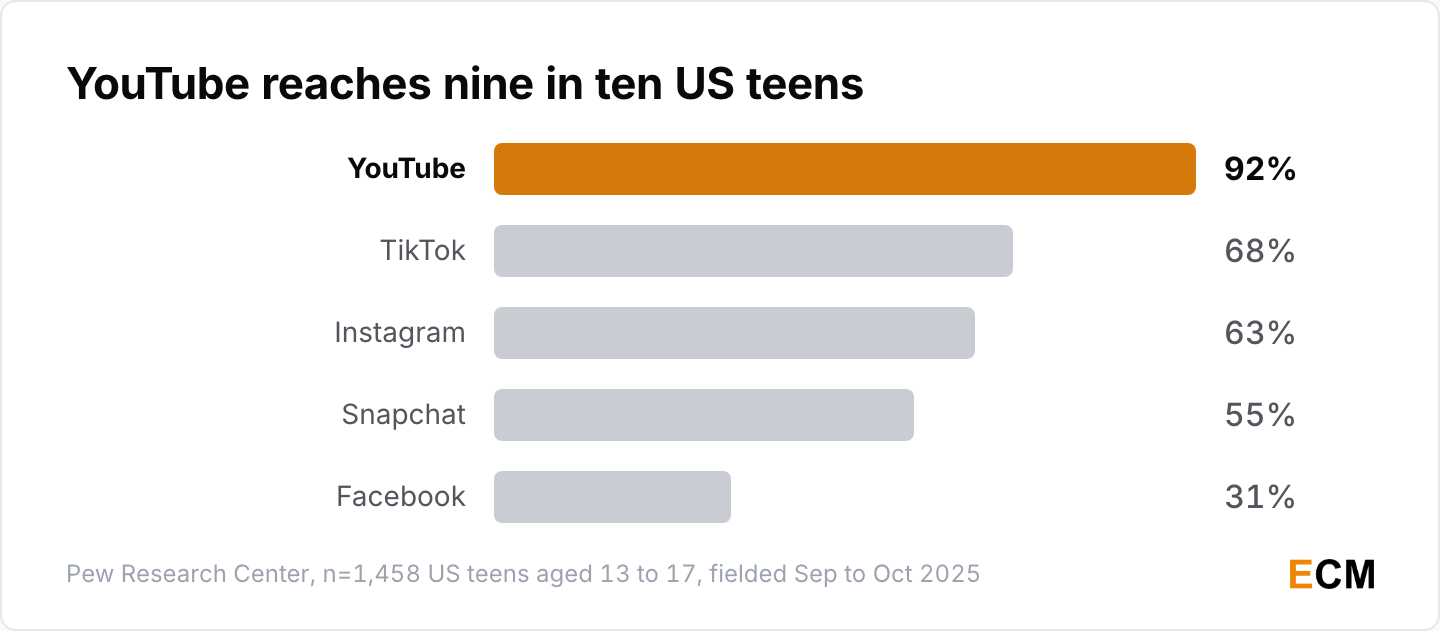
- 92% of US teens use YouTube, 76% use it daily and 17% say they are on it almost constantly (Pew Research Center, n=1,458 US teens, fielded September to October 2025 via Ipsos KnowledgePanel).
- 68% of teens use TikTok, 63% Instagram, 55% Snapchat and 31% Facebook (Pew topline, December 2025).
Note how far YouTube’s 92% sits above TikTok’s 68%. Teen behavior puts 24 points between the two; marketer effectiveness ratings put 40. Both rank YouTube first, for different reasons.
How Mobile Shapes Global Video Reach
Almost everyone who is online now reaches video through a phone, which fixes the aspect ratio before anyone picks one.
- 6.12 billion people were using the internet at the start of April 2026, 73.8% of the world’s population, up from 6.04 billion at 73.2% in the October 2025 edition (DataReportal, April 2026; Digital 2026).
- 96.2% of internet users go online via a mobile phone at least some of the time (DataReportal, April 2026).
Those two readings come from different data vintages, October 2025 against April 2026, and DataReportal tells readers not to calculate trends across its reports. It puts internet-user growth at 59 million for the whole twelve months to April 2026, less than the 80 million gap between the two figures. Treat that gap as bookkeeping rather than growth.
Video Marketing Statistics Then and Now: 2020 vs 2026
Plenty of the video marketing statistics still in circulation were measured in 2020. Here is what each one said, who published it, and what the number is today.
| The 2020 statistic | Where it came from | Where it stands in 2026 |
|---|---|---|
| 85% of businesses use video as a marketing tool | Wyzowl, State of Video Marketing 2020 | Now 91% (Wyzowl 2026, in the adoption section above) |
| 92% of marketers who use video say it is an important part of their strategy | Wyzowl 2020 | Now 93% (Wyzowl 2026) |
| 66% of people would prefer a short video to learn about a product, against 18% who would rather read an article | Wyzowl 2020 | Now 63% against 12% (Wyzowl 2026, in the consumer section above) |
| Most-created video types: explainer 72%, presentation 49%, testimonial 48%, sales 42%, video ads 42% | Wyzowl 2020 | Now social videos 69%, explainers 68%, testimonials 57%, presentations 48%, video ads 48% (Wyzowl 2026) |
| 87% of video marketers say video increased traffic to their site, and 81% say it increased time on page | Wyzowl 2020 | Now 82% say video increased web traffic and 82% say it increased dwell time (Wyzowl 2026) |
| 59% of non-video marketers expected to start using video in 2020, and 20% of video marketers had used video for the first time in 2019 | Wyzowl 2020 | At 91% adoption the question no longer discriminates |
| People watch an average of 16 hours of online video a week, a 52% rise in two years, and 86% would like to see more video from brands | Wyzowl 2020 | Now 84% want more video from brands (Wyzowl 2026) |
| Over 2 billion logged-in users visit YouTube each month, and people watch over a billion hours of video a day | YouTube press page, June 2020 | YouTube has stopped publishing a precise user figure and now says only “billions of monthly logged-in users”. The watch-time measure now appears as over 1 billion hours a day on TV screens alone |
| 82% of all IP traffic would be video by 2022, and live internet video would reach 17% of internet video traffic after growing 15-fold from 2017 to 2022 | Cisco Visual Networking Index white paper, 2017 forecast | Cisco stopped publishing the VNI in 2020 and no successor publishes a single video-traffic percentage. See the FAQ below |
| 91% of marketers are satisfied with the ROI of their social video, and 93% of businesses landed a customer through a social video | Animoto, Social Video Trends: Marketers 2020 | The current ROI reading is 82% (Wyzowl 2026) |
| Video ads are the number one way people move from discovering a brand to buying from it | Animoto, Social Video Trends: Consumers 2020 | No current primary source makes this ranking claim |
| Facebook is the most popular channel for marketers posting video at 81.2%, followed by YouTube at 62.9%, and 14.5% of marketers publish no video | Buffer, State of Social 2019 | Now YouTube leads marketer-rated effectiveness at 69% (Wyzowl 2026). Wistia’s 2026 data puts LinkedIn ahead of YouTube on where teams share video |
| Videos earn 59% more engagement than other Facebook post types, and 81.8% of the top 500 posts were video | Buffer, analysis of 777 million Facebook posts, 2019 | Buffer has not refreshed the dataset |
| Only 0.3% of Pinterest pins contain video | Buffer, study of 1.5 million pins, 2016 | No current equivalent exists |
| Twitter video views grew 220x in twelve months, 93% of them on mobile, and tweets with video are 6x more likely to be retweeted than tweets with an image and 3x more likely than tweets with a GIF | Twitter Business, video-on-Twitter resource page | X publishes no comparable figure. X sits at 16% marketer-rated effectiveness (Wyzowl 2026) |
| TikTok reached 500 million monthly active users in October 2018 | CNN, October 2018 | ByteDance publishes nothing, so no audited user figure exists. The platform section above holds the only current ByteDance data, all of it leaked or third-party |
| Native LinkedIn videos are shared 20 times more than any other content type | TechCrunch, August 2017, reporting LinkedIn’s limited-release data | LinkedIn never published a source for it. The current LinkedIn measure is 81% of teams sharing video there (Wistia 2026) |
| The average business video was 4.07 minutes in 2018, 73% of business videos ran under two minutes, and 87% of business videos were watched on desktop | Vidyard, 2019 Video in Business Benchmark Report | Vidyard no longer publishes an average video length or a device split. The length section above holds the closest current data |
| A single webinar could net $20,930 | ClickMeeting webinar report | It was a single-case figure, never a benchmark. Current webinar data sits on the webinar statistics page |
| 65% of people skip online video ads as soon as they can | CNBC, February 2017 | No current primary source |
| 20% of non-video marketers say video is too expensive, with 17% each saying they don’t know where to start and don’t feel it’s needed | Wyzowl 2020 | Now 24% each on “not needed” and “too expensive” (Wyzowl 2026) |
| 92% of video marketers feel the level of noise and competition has increased in the last year | Wyzowl 2020 | Wyzowl no longer asks the question |
| 95% of video marketers plan to increase or maintain their video spend in 2020 | Wyzowl 2020 | Now 92% plan to spend the same or more in 2026 (Wyzowl 2026) |
| First-time video marketers in 2019 got started because it was easier to convince others of video’s value (48%) and because video had become quicker to create (47%) | Wyzowl 2020 | Wyzowl no longer breaks out first-time adopters |
| 83% of video marketers who had used YouTube said it was successful for them | Wyzowl 2020 | Now YouTube leads marketer-rated effectiveness at 69% (Wyzowl 2026) |
| 88% of video marketers plan to include YouTube in their strategy | HubSpot Research, content trends global preferences (the page has since been taken down) | Now YouTube is the highest-rated video platform at 69% marketer-rated effectiveness (Wyzowl 2026) |
| Only 1 in 10 video marketers have tried TikTok, and 66% of those saw success | Wyzowl 2020 | Wyzowl no longer publishes a TikTok trial or success rate. TikTok sits at 29% marketer-rated effectiveness, the nearest current measure |
| 54% of consumers prefer video content from brands they support over other content types | HubSpot, named but never linked to a report | No current HubSpot report publishes this figure. The closest current measure is 84% of consumers wanting more video from brands (Wyzowl 2026) |
| The three most popular types of business video are webinars, demos and social videos | Vidyard, 2019 Video in Business Benchmark Report | Now social videos 69%, explainers 68%, testimonials 57% (Wyzowl 2026) |
| Under 45 seconds, mobile leads video consumption in Australia at 69%; over 55 seconds the non-connected living-room widescreen leads at 61% | Facebook Business, ANZ Video Consumption Report (the page has since been taken down) | Meta publishes no successor report |
| YouTube is the second most popular website in the world, after Google | Alexa Top Sites | Amazon shut Alexa’s ranking service down in May 2022, so no current equivalent exists |
| More than 50% of shoppers say online video has helped them decide which specific brand or product to buy | Think with Google, YouTube strategy to drive action | No current primary source republishes it |
| Half of people seek out videos that give them new perspectives, and 51% say they need to connect with and better understand others through video | Think with Google, video search behavior trends | No current primary source republishes it |
| 4 in 5 people use digital video to learn new skills | Think with Google, video search behavior trends | No current primary source republishes it |
| More than half of people would give up video and other media in exchange for faster-loading websites | Unbounce Page Speed Report | Unbounce has not refreshed the study |
| India’s online video audience was projected to reach 500 million in 2020 | Deloitte TMT Predictions, India | It was a forecast rather than a measurement, and the forecast year has passed |
| Live video is the third most popular social media tactic brands are implementing | HubSpot State of Marketing, social media trends (the page has since been taken down) | HubSpot no longer publishes the ranking |
| Video is the fastest-growing advertising tool on Twitter | Twitter Business, how video is reshaping digital advertising (the page went down with the move to X) | X publishes no comparable figure. X sits at 16% marketer-rated effectiveness (Wyzowl 2026) |
| Direct-to-consumer advertisers are more likely to spend on stories and shoppable ads | IAB Video Advertising Spend Report 2019 | IAB no longer breaks out DTC spending on stories and shoppable ads. The ad spend section above holds the current IAB video figures |
| YouTube, Facebook and Instagram are the top three purchase-driving platforms | No source was ever attached to it | No current primary source makes this ranking claim |
Related data on this site. Content marketing statistics, digital marketing statistics and YouTube statistics.
Frequently Asked Questions
How many businesses use video marketing in 2026?
91% of businesses use video as a marketing tool, a joint all-time high in Wyzowl’s twelfth annual wave (Wyzowl, n=266, fielded late 2025).
Wyzowl is a video production agency and its respondents self-select for video commitment, so read this as the ceiling of a committed population rather than a census of all businesses.
Is video marketing still worth the investment?
Satisfaction fell while spending did not. 82% of marketers say video gives good ROI, down from 93% a year earlier, and yet 92% plan to spend the same or more in 2026 (Wyzowl, 2026).
On the buyer side the money is unambiguous: US digital video ad revenue grew 25.4% to $78.0 billion in 2025, faster than any other format (IAB/PwC, April 2026).
What are the current trends in video marketing?
Money is moving to connected TV and social video, which reached $26.5 billion and $28.2 billion in 2025 (IAB, 2026 report). Generative AI now touches 33% of a buyer’s digital video ads, up from 24% (IAB, 2026). And streaming took 47.5% of US TV viewing in December 2025, an all-time high (Nielsen, 2026).
What are the most popular types of video marketing content?
Social media videos are the most-created type in 2026 at 69% of video marketers, followed by explainers at 68%, testimonials at 57%, presentations at 48% and video ads at 48% (Wyzowl, 2026).
Live action dominates the production style at 51%, against 23% for animated video and 19% for screen recordings (Wyzowl, 2026).
How many marketers use AI to create video?
Close to two in three on the current evidence. Wyzowl puts it at 63% of video marketers who have used AI to create or edit video (Wyzowl, 2026), and IAB’s 2026 buyer survey independently puts current use at 62% (IAB, n=360).
Wistia’s 2026 edition is lower, at more than a third of teams, because it asks a narrower question about AI inside a production workflow (Wistia, 2026).
What is the best video length in 2026?
71% of marketers say 30 seconds to 2 minutes is most effective (Wyzowl, 2026), and Wistia’s analysis of 13M+ videos found those under one minute had the highest average engagement rate at 52% (Wistia, 2026).
The counter-trend sits in B2B, where videos over 20 minutes grew 420% in a year (Vidyard, 2025).
What is the 70/20/10 rule in marketing?
It is a budget-splitting convention rather than a measurement: 70% of spend on what already works, 20% on emerging channels and 10% on experiments. Video rarely gets treated that way, because 46% of marketers give video a third or less of their marketing budget and 17% do not track video spend at all (Wyzowl, 2026).
How much of US TV viewing is streaming?
47.5% in December 2025, an all-time high, against 21.4% for broadcast and 20.2% for cable (Nielsen The Gauge, 2026).
On Nielsen’s separate distributor ranking, YouTube held 12.5% of TV in January 2026, more than any individual streaming service (Nielsen, 2026). Nielsen measures TV screens only, so those shares cover TV rather than mobile or tablet.
Which platforms do marketers rate most effective for video?
YouTube at 69%, then Instagram at 56%, Facebook at 55%, LinkedIn at 50% and webinars at 42%, with TikTok at 29% (Wyzowl, 2026).
Wistia’s 2026 data has LinkedIn ahead of YouTube as the place teams share video, 81% to 76%, across all teams rather than B2B alone (Wistia, 2026).
Is the “82% of internet traffic will be video” statistic still valid?
No. That figure came from Cisco’s Visual Networking Index forecast, which Cisco stopped publishing in 2020 when it folded into the Annual Internet Report.
The closest current replacement, AppLogic Networks’ Global Internet Phenomena Report, publishes no single video traffic-share percentage. It does report that YouTube reaches 88% of fixed-access subscribers and consumes more than 10% of internet bandwidth (AppLogic Networks, 2025).
Written by
Editorial Staff
The Editorial Staff represents the writers, editors, and content creators who have worked (or work) at Elite Content Marketer. The experimenter-in-chief behind the team is Chintan Zalani, who has close to a decade of experience trying to make sense of the content marketing industry. Started in 2019, Elite Content Marketer is on a mission to help creators build sustainable businesses.
Related Articles

Marketing Data
58 AI Personalization Statistics for 2026: ROI + Adoption
58 AI personalization statistics for 2026: 78% of marketers can’t make enough personalized content, and 87% of brands rate it good while 29% of consumers agree.
Oct 2, 2026Read more →
Marketing Data
60 AI Workflow Automation Statistics for 2026
60 AI workflow automation statistics for 2026: 37% of respondents see any EBIT impact from AI, 6% are high performers, and agents scale at big firms.
Oct 1, 2026Read more →
Marketing Data
AI Image Generation Statistics 2026: 60 Data Points
60 AI image generation statistics for 2026: people now create more than 3 billion images a week with ChatGPT Images and OpenAI’s API.
Sep 30, 2026Read more →