The live streaming industry has continued to grow and evolve in 2022, with more businesses and individuals utilizing this technology to connect with their audiences in real time. The increased availability of high-speed internet and the proliferation of mobile devices have made it easier for people to access and engage with live-streaming content.
In this article, we will explore some of the latest statistics and trends in the live streaming industry, highlighting how it is being used and its potential for the future.
Live Streaming Statistics: Overview
First, let’s try to get a comprehensive overview of the industry’s current state. From the number of users and the amount of content being streamed to the platforms and devices being used, these statistics paint a picture of a rapidly growing and highly dynamic market.
In this section, we will take a closer look at some of the key trends and developments in the live streaming industry, highlighting how it is being used and the opportunities it presents for businesses and individuals alike.
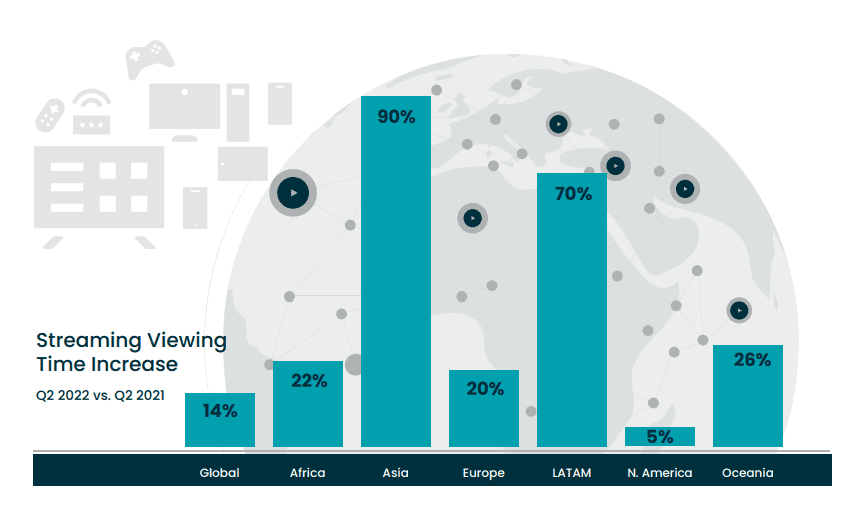
1. Global streaming viewing time was up 14%, as compared to 2021. (Stream Hatchet)
2. In North America, the most mature streaming marketing in the world, viewing increased by 5%. (Stream Hatchet)
3. 32% of YouTube users worldwide had watched a live streamed video on the platform within the past month. (Insider Intelligence)
4. The Global Live Streaming Market is projected to reach USD 534.37 Billion by 2030, growing continuously at a 29.3% annual growth rate. (Market Research Future)
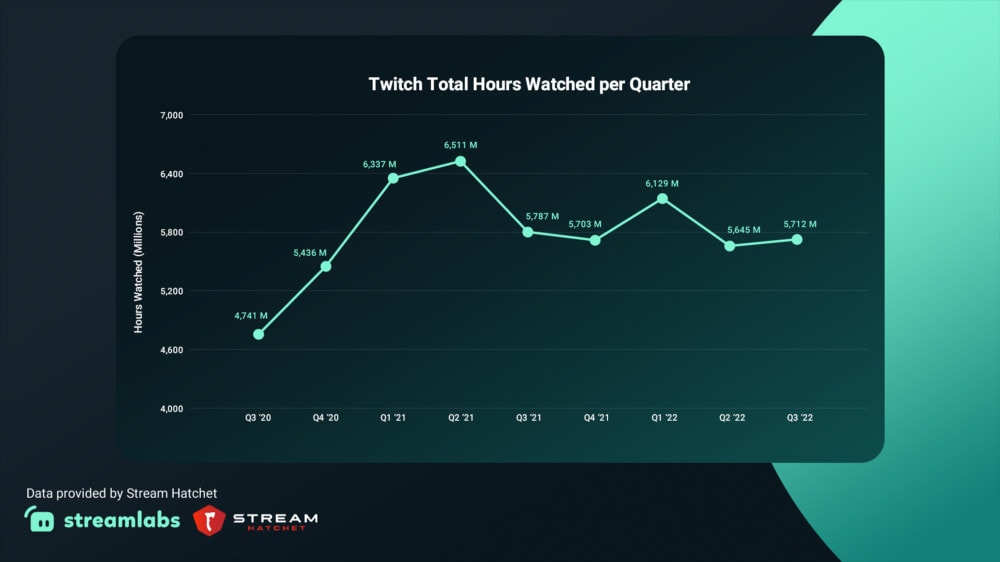
5. Viewers watched 5.7 billion hours of live streams on Twitch in Q3, up from 5.6 billion hours in the previous quarter. (Streamlabs)
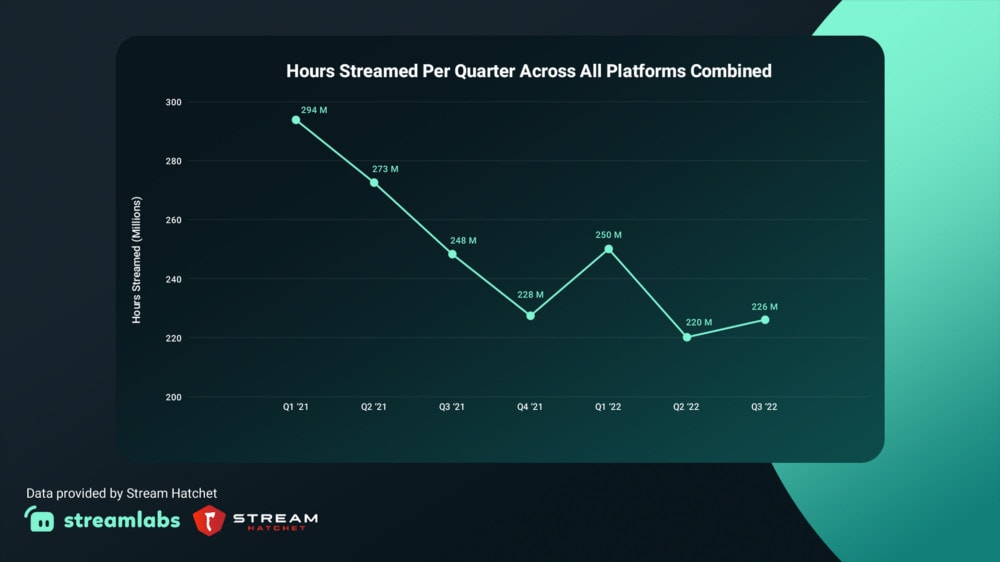
6. Streamers broadcasted 226 million hours of content across all platforms, up from 220 million in the previous quarter. (Streamlabs)
7. In 2021, 1.3 trillion minutes were watched on Twitch, with 31 Million average daily visitors and 8 Million unique streamers every month. (Twitch Advertising)
8. In 2020, global users spent approximately 482.5 billion hours on live streaming apps. 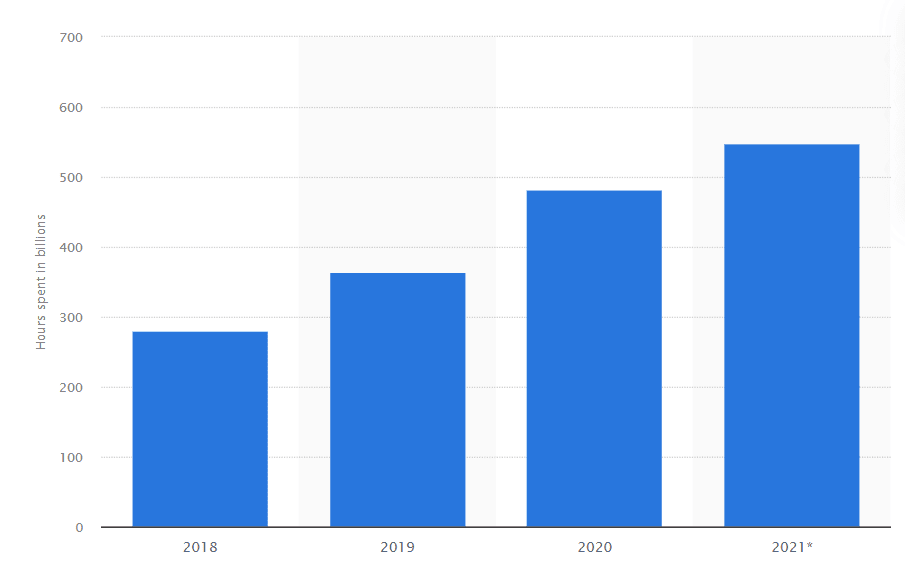
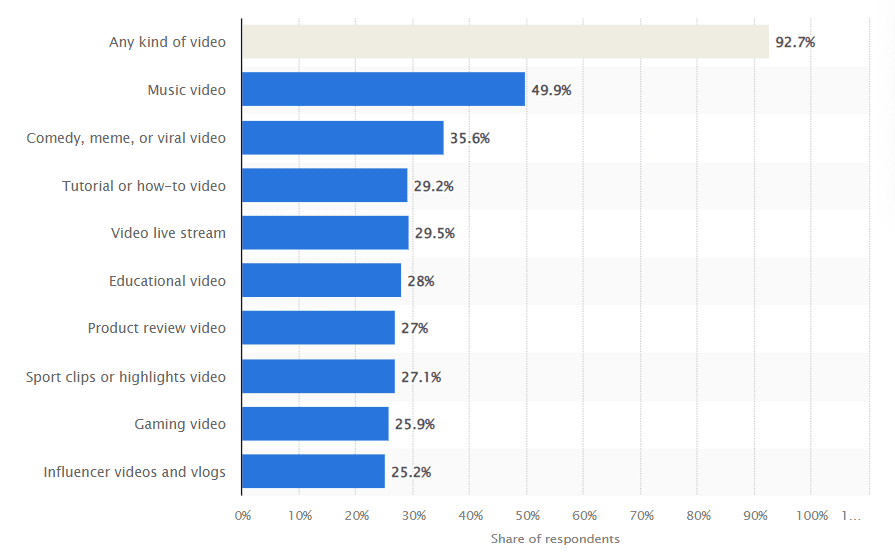
9. During the second quarter of 2022, live streaming had an audience reach of 29.5% of all internet users worldwide. (Statista)
Live Video Content Stats Across Social Media Platforms
In this section, we will explore the latest statistics on live video content across a range of social media platforms to examine how users consume this content, the types of content that are most popular, etc.
This is to give the reader a scent of potential opportunities and challenges for businesses looking to leverage these platforms for live streaming.
1. 25% of GenZ use video streaming platforms because of live events and exclusive content, according to Statista. (Statista)
2. According to a study, approximately a third of internet users watch live video streams more than any other type of video content each week. (Digital 2022 Global Overview Report).
3. 93% of internet users aged 16 to 64 watch TV content via streaming services each month. (Digital 2022 Global Overview Report).
Audience Demographics
One of the key factors influencing the success of a live streaming event’s success is its audience’s makeup. In this section, we will examine the audience demographics for live streaming, examining age, gender, etc.
1. Nearly 75% of Twitch viewers are between 16 and 34. (Twitch Advertising)
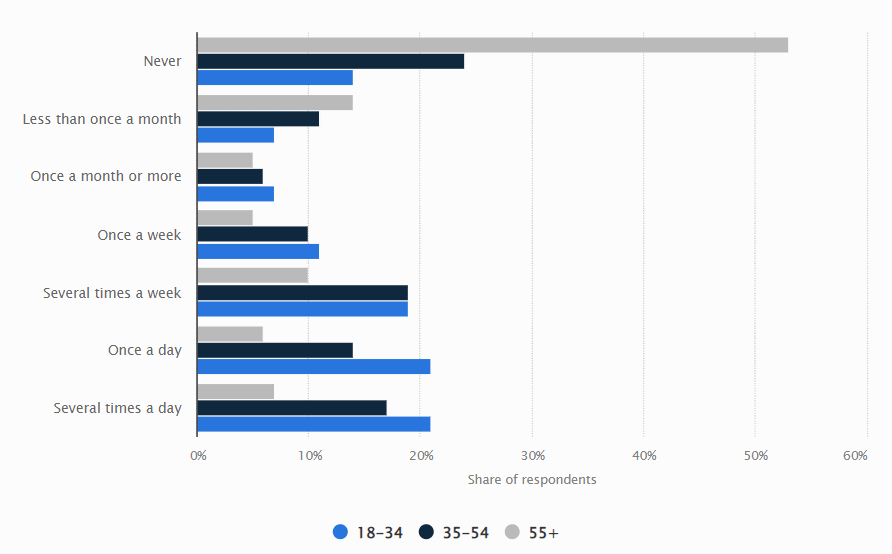
2. YouTube Live and Instagram had a higher usage among live online viewers aged between 18 and 34 years, while users aged between 35 and 54 preferred Facebook Live. (Statista)
Audience Behavior
The behavior of live streaming audiences can provide valuable insights for businesses looking to engage with their audience in real time.
In this section, we will explore the latest statistics on audience behavior, examining how viewers interact with live streaming content, the types of content they prefer, and the factors that influence their engagement with this content.
By understanding the behavior of live streaming audiences, businesses can create more effective and engaging content and build stronger and more lasting connections with their audience.
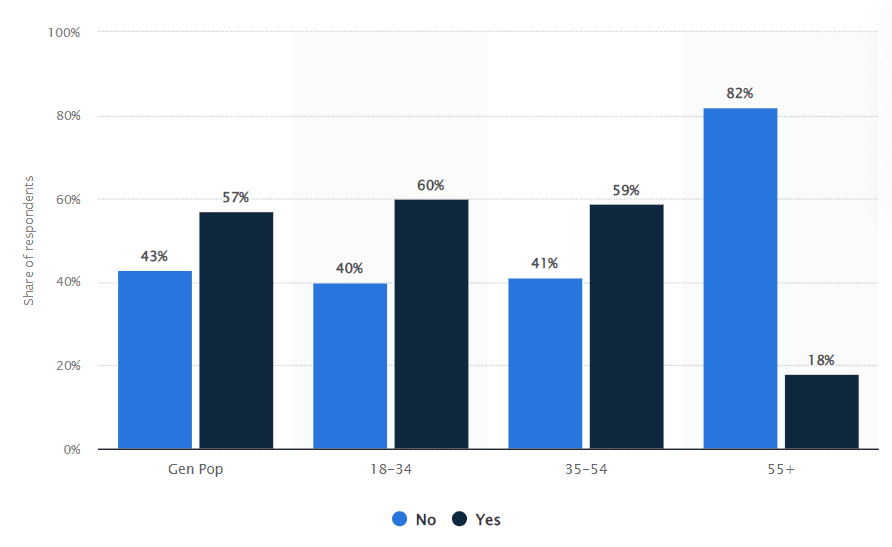
1. 61% of 18-34-year-olds watched a live stream several times a week or more frequently. (Statista)
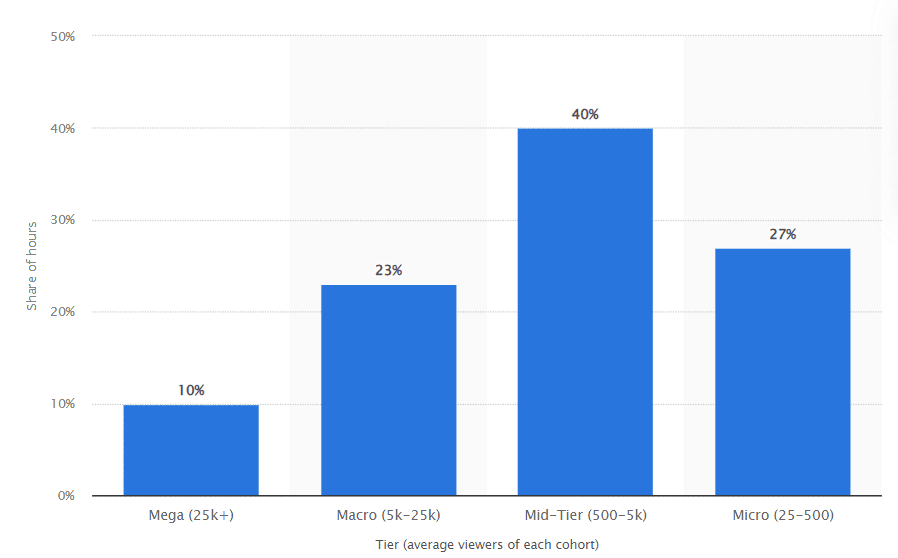
2. Mid-tier influencers captured 40% of all live streaming hours in the leading streaming platforms. (Statista)
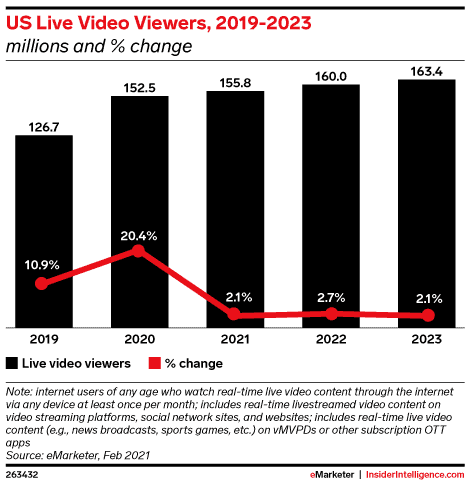
3. According to a forecast by Insider Intelligence, 163.4 million people will be watching lives streams in the US by 2023. (Insider Intelligence)
4. 46% of people in the US reported that their engagement with live streaming increased. (Statista)
5. The latest data shows that live streamed content accounts for nearly a quarter of all global viewing time and has been shown to drive 27% more minutes of watch time per viewing than on demand video. (Vimeo)
Live Streaming Gaming Stats
The live streaming gaming industry has experienced rapid growth in recent years, with many gamers turning to platforms like Twitch and YouTube to share their gameplay with others.
In this section, we will explore the latest statistics on live streaming gaming, examining the popularity of this content, the platforms being used, and the potential opportunities for businesses in this space.
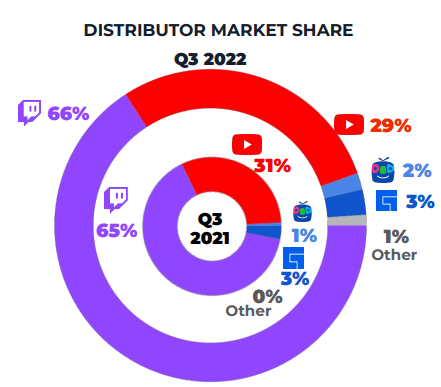
1. Twitch is the largest video game streaming platform, with a 72% market share as of Q3 2022. (Stream Hatchet) 
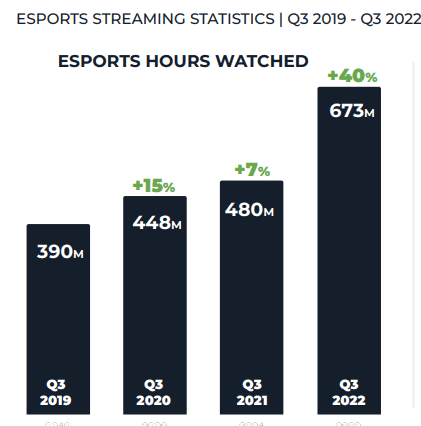
2. The eSports segment has seen a whopping 40% increase in streaming traffic compared to last year. (Stream Hatchet)
3. 66% of eSports streaming toccurson Twitch, while YouTube comes second. (Stream Hatchet)
4. GTA V remains the most popular game streamed as of Q3 2022, watched for over 443 million hours. (Stream Hatchet) 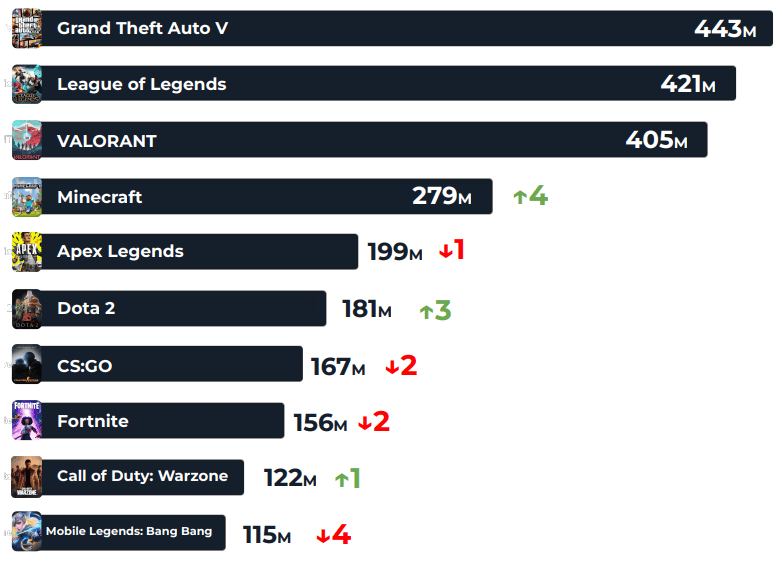
5. Viewers watched 1.176 billion hours of live streams on YouTube Gaming in Q3, up from 1.131 billion hours in the previous quarter. (Streamlabs)
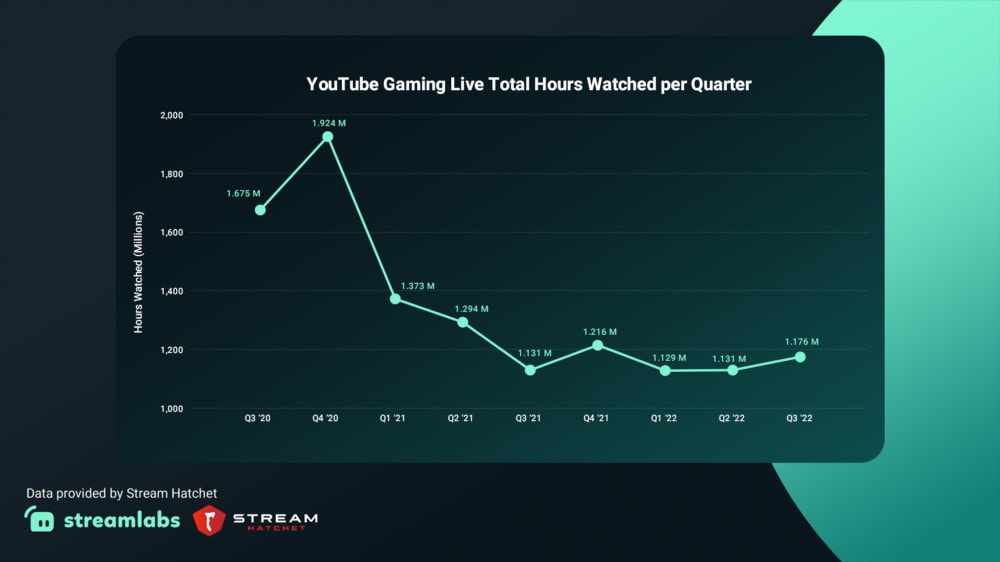
6. 443 thousand unique channels streamed on YouTube Gaming in Q3, up from 432 thousand in the previous quarter. (Streamlabs)
7. xQcOw is the most popular gaming streamer worldwide. (Statista) 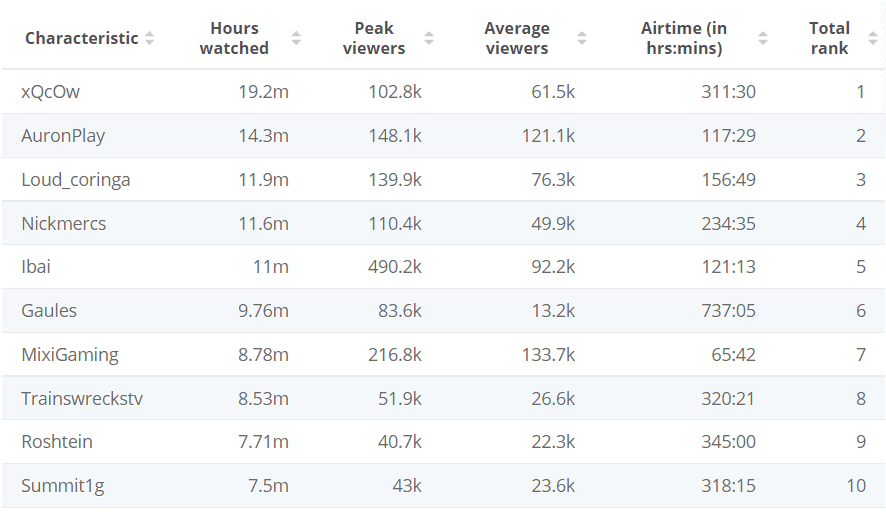
8. GTA V is the top game streaming on Twitch, followed by Valorant. (Statista)
Live Streaming OTT Platform Stats
Over-the-top (OTT) platforms have emerged as a major force in the live streaming industry, providing users with access to a wide range of content on various devices.
We will now explore the latest statistics on live streaming OTT platforms, including the number of users and the amount of content consumed. This will help entrepreneurial minds like you understand the potential opportunities they can exploit.
1. Big screens, like Smart TVs, capture nearly 77% of all streaming viewing hours worldwide. (Conviva)
2. Android TVs are a top-five device in five of the six major streaming TV markets and saw an 81.9% increase in viewing hours yyearly (Conviva)
3. 37.6% of all streaming occurred on Smart TVs in North America. (Conviva) 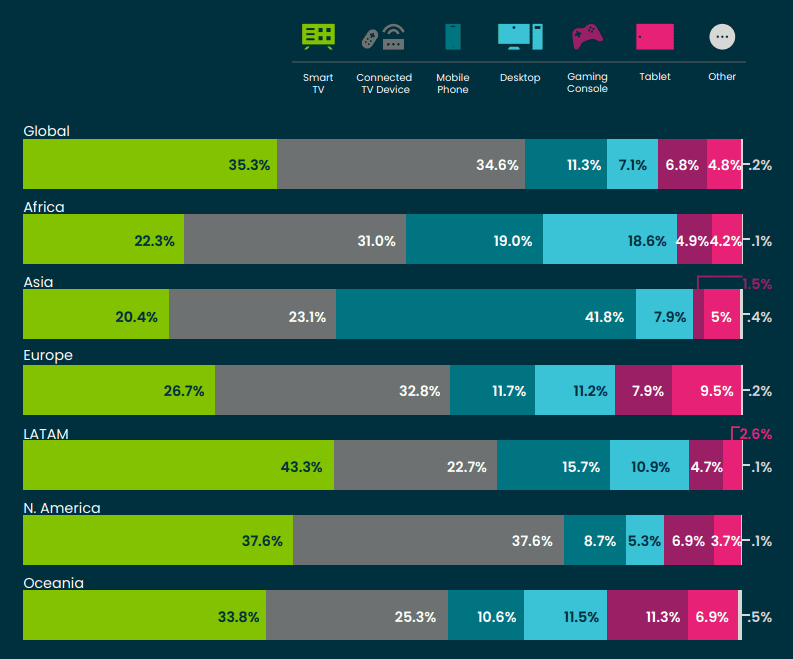
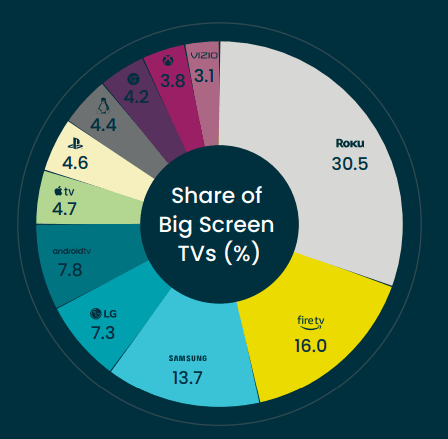
4. Roku continues to be the most popular video streaming app, with about 30.5% market share. (Conviva)
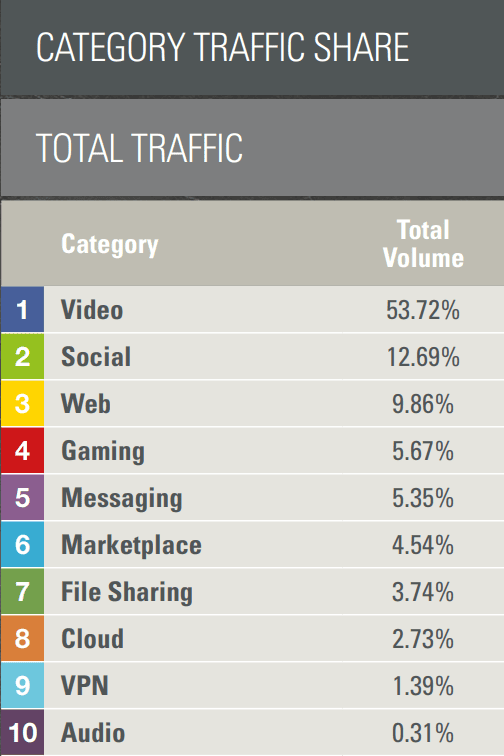
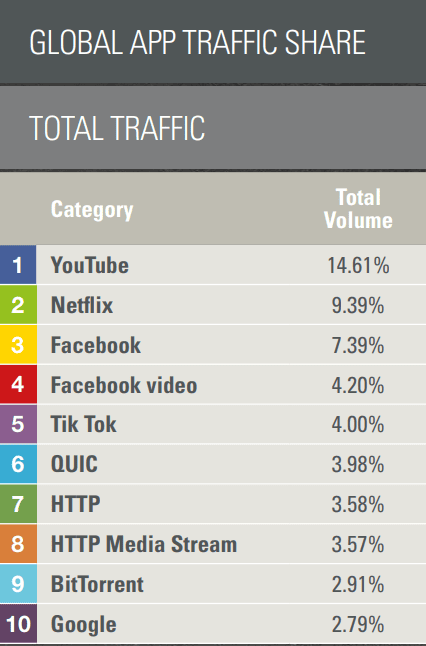
5. In 2021, streaming video dominated internet bandwidth, accounting for 53.72%. (Sandvine)
6. YouTube, Netflix, and Facebook video streaming were the top 3 platforms on which video was streamed in 2021. (Sandvine)
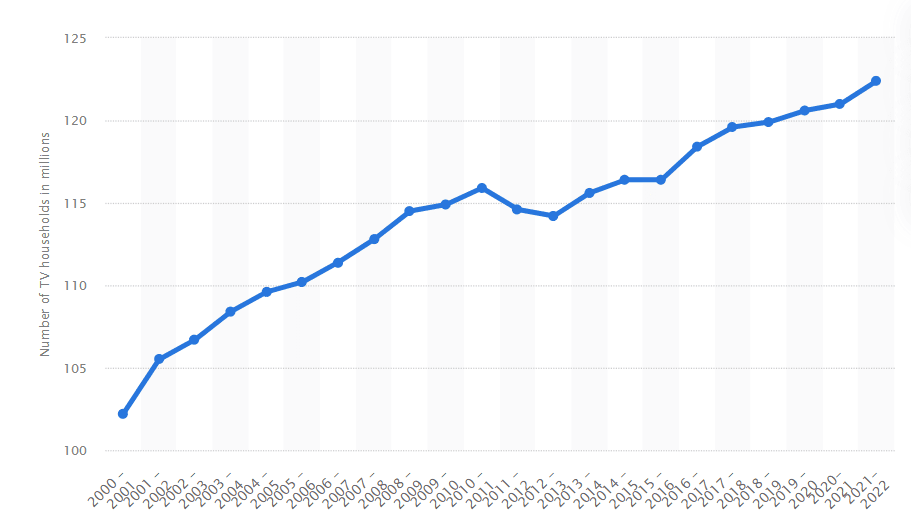
7. There are currently 122.4 million households with TVs in the US. (Statista)
Statistics Related to Shopping and Monetization on Live Streams
The ability to shop and monetize live streams has become an increasingly important part of the live streaming industry, with many businesses and individuals using these features to generate revenue from their content.
Due to this reason, we will explore the latest statistics on shopping and monetization on live streams, including the platforms and features being used, the types of products and services being sold, and the potential opportunities and challenges for businesses in this space.
By understanding the current state of the market, businesses and enterprising minds like you can develop strategies to capitalize on the growing popularity of live streaming as a tool for commerce and monetization.
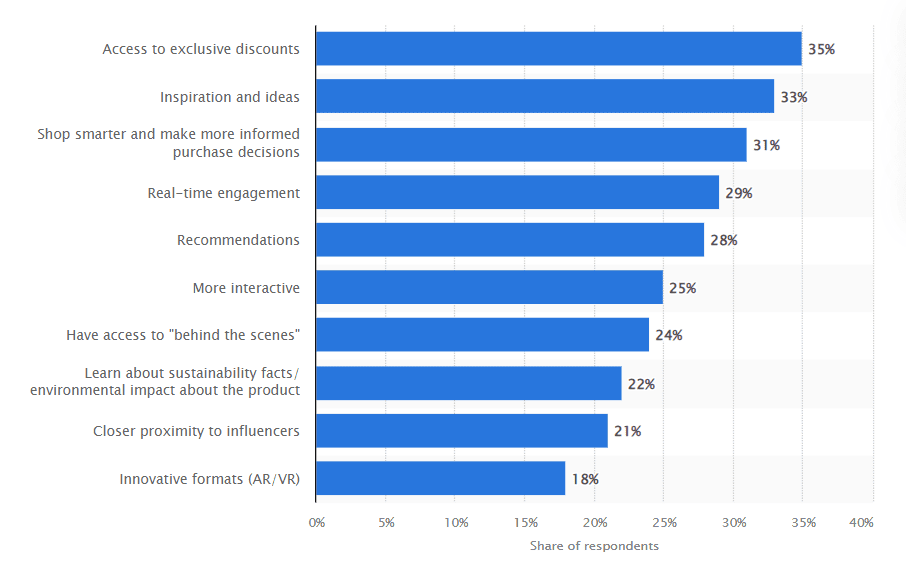
1. Access to live streams is the no.1 benefit of purchasing things on live streams. (Statista)
2. Mobile marketplace NTWRK hosted four live “shopping festivals” in the US that have generated more than 10 million views each and resulted in 250,000 active buyers. (Insider Intelligence)
3. Social media networks are the most popular platforms for livestream e-commerce in the United States, i.e., shopping during streaming. (Statista) 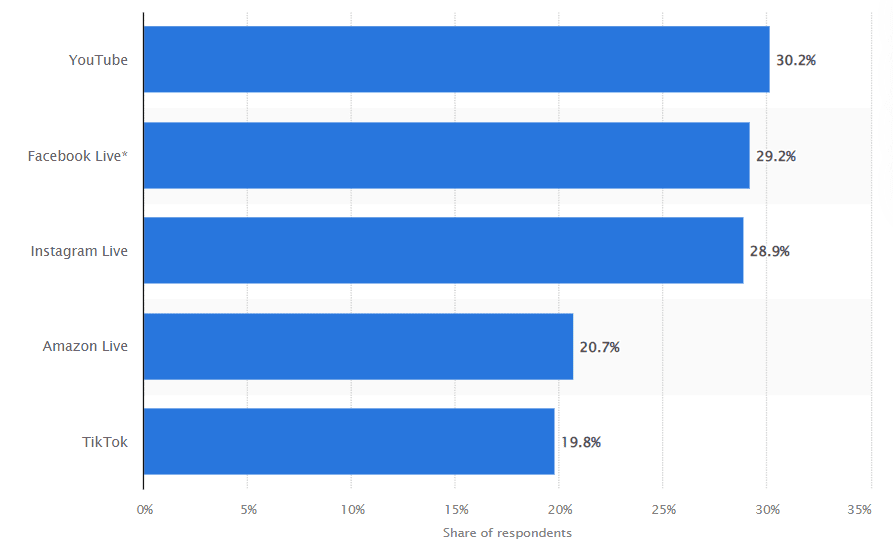
4. The value of shopping during streaming is expected to reach $55 Bn by 2022. (Statista) 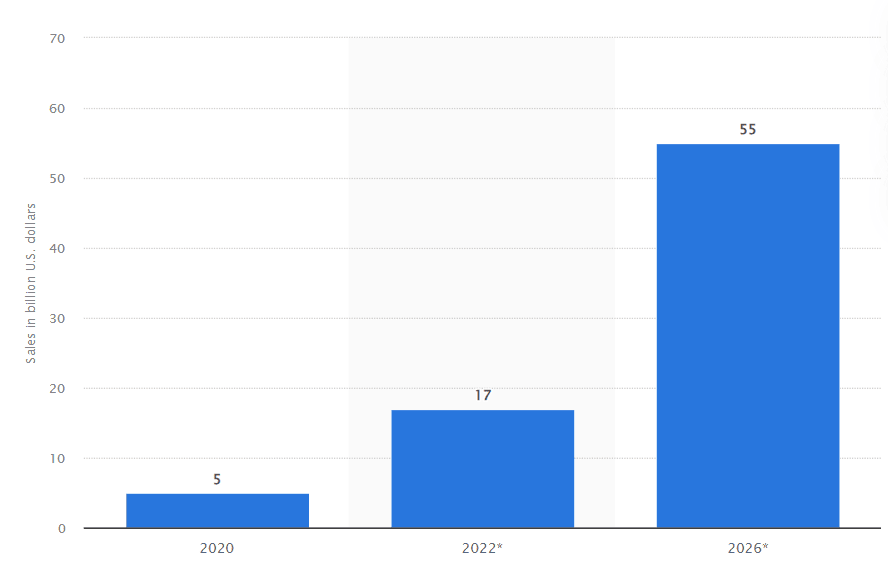
5. In 2020, TikTok collaborated with Walmart for an hour-long holiday shop-along. This event helped increase Walmart’s follower base by 25%. (Influencer Marketing Hub)
6. Chinese apps like Taobao, which earned over $400 billion in sales from live video streaming in 2021. (Influencer Marketing Hub)
7. The product categories most often showcased in live commerce are apparel and fashion, with a 36 percent share, followed by beauty products and food, with roughly 7 percent each. (McKinsey)
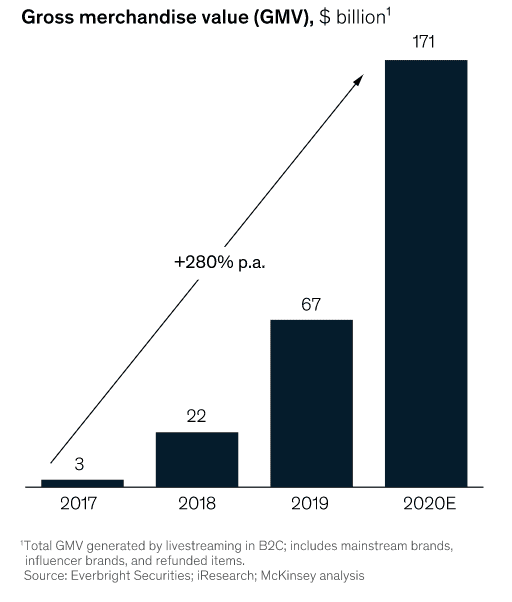
8. The value of China’s live-commerce market grew at a compound annual growth rate (CAGR) of more than 280 percent between 2017 and 2020 and was expected to reach an estimated $171 billion in 2020. This can be an indicator of how the US market will perform. (McKinsey)
Live Stream for Business and Marketing: Statistics and Trends
Live streaming has become an important tool for businesses and marketers looking to engage with their audience in real time. That is why we will examine the platforms and features being used, the types of content that are most effective, and the potential opportunities and challenges for businesses in this space.
By understanding the current state of the market, businesses can develop strategies to leverage the power of live streaming to connect with their audience and drive growth.
1. 84% of viewers believe showing support for streamers is an important part of the Twitch experience. (Twitch Advertising)
2. 76% of viewers appreciate brands that help their favorite streamers achieve success. (Twitch Advertising)
3. 26% of video marketers plan to include Facebook Live in their 2022 video marketing strategy. (Wyzowl)
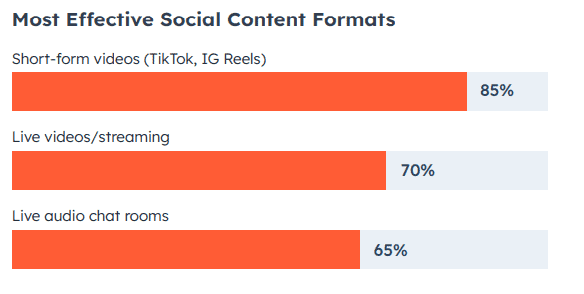
4. 70% of marketers think live streaming is a highly effective social media marketing strategy. (HubSpot)
5. It is essential for marketers to know that live videos hold users’ attention 10-20x longer than pre-recorded, on-demand content. (Vimeo)
6. 60% of streamers aged between 18-34 have generated revenue from their streaming. (Statista)
Final Thoughts
The live streaming industry has continued to grow and evolve in 2022, with more businesses and individuals leveraging this technology to connect with their audience in real time. In this report, we have explored some of the latest statistics and trends in the live streaming industry, highlighting how it is being used and its potential for the future.
As we have seen, the live streaming market is highly dynamic, with new platforms and features emerging regularly. With this understanding, you can take advantage of the live streaming market and make your mark.
