88% of consumers now call trust in a brand an important or critical purchase criterion, level with value and one point behind quality (Edelman, 2026 Special Report: Brand Growth in an Insular World, 2026). These branding statistics cover brand value, trust, authenticity, social media, loyalty and B2B buying.
Branding Statistics 2026: 60 Facts You Need to Know
 Written by Editorial Staff
Key Takeaways
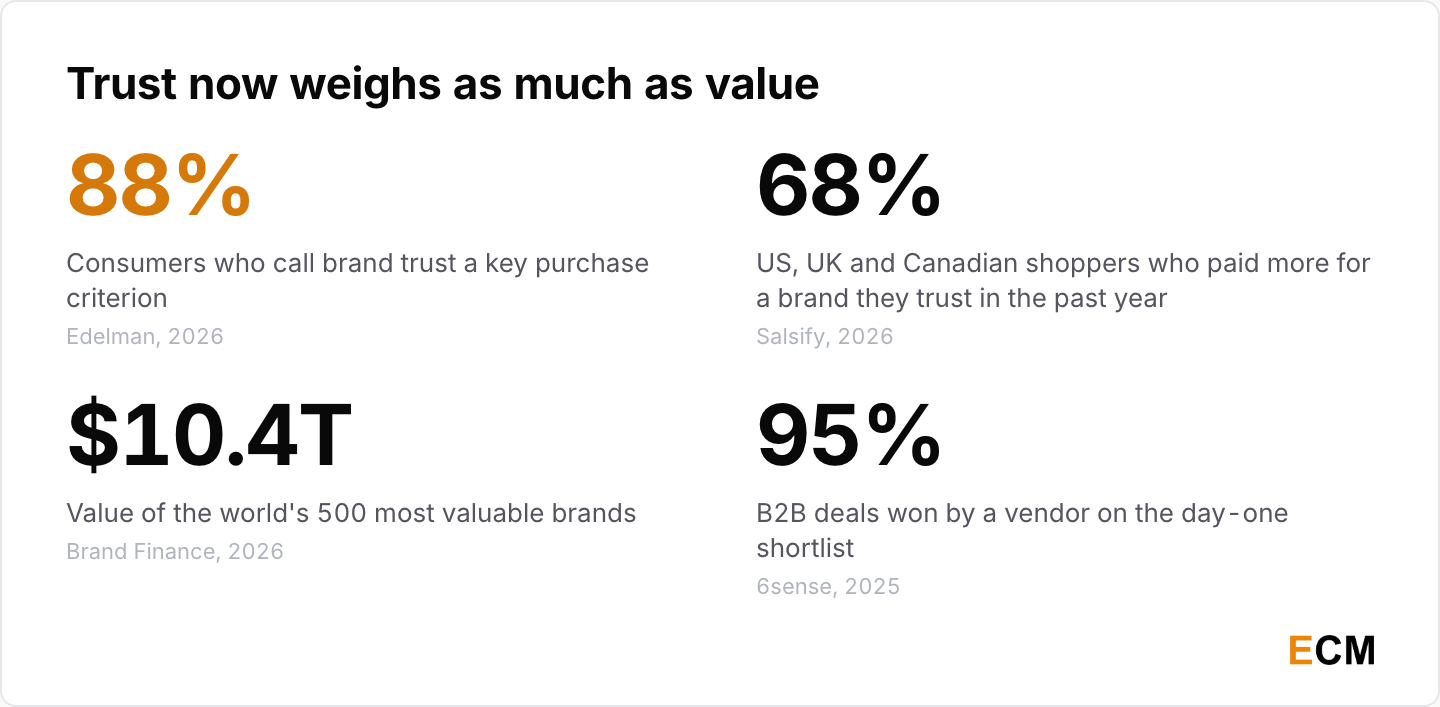
- Brand value keeps climbing. The world’s 500 most valuable brands are worth $10.4 trillion in 2026, up 11% in a year, and Apple leads at $607.6 billion (Brand Finance, Global 500 2026, 2026).
- Trust weighs as much as value. 88% of consumers rank trusting a brand as a key purchase criterion, the same share as value (Edelman, 2026 Special Report: Brand Growth in an Insular World, 2026).
- Shoppers pay a premium for trust. 68% of shoppers in the US, UK and Canada paid more for a product in the past year because they trusted the brand, including 82% in the US (Salsify, 2026 Consumer Research Report, 2026).
- Customers outsell the brand. 79% of consumers say user-generated content highly impacts their purchases, against 12% for branded content (Stackla, Post-Pandemic Shifts in Consumer Shopping Habits, 2021).
- Gen Z searches social first. 41% of Gen Z turn to social media first when they look for information online (Sprout Social, social media search, 2025).
- B2B brands win before the first call. The winning vendor sat on the buyer’s day-one shortlist 95% of the time in 2025 (6sense, 2025 Buyer Experience Report, 2025).
- Customer experience turned up in 2026. Forrester’s US and Canada CX Index fell four years running to an all-time low in 2025, then 26% of brands there made significant gains in 2026 against 7% that declined (Forrester, 2026 CX Index, 2026).
Brand Value Statistics: The Most Valuable Brands in 2026
Brand value is the one branding number with a market price attached. Three firms publish annual rankings, and their methods differ enough that I’d always name the ranker next to the figure.
The World’s Most Valuable Brands
Apple, Microsoft, Google and Amazon top all three major rankings, but the rankers disagree on the order and the dollar values.
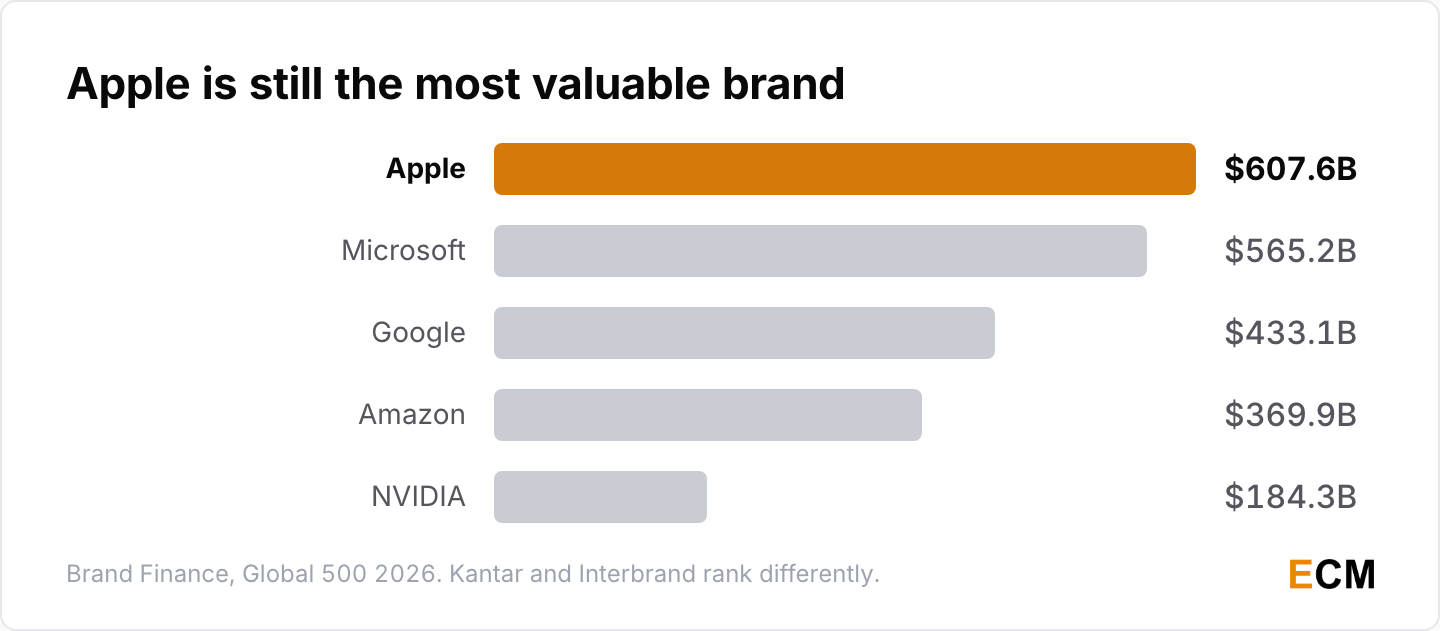
- Brand Finance values Apple at $607.6 billion in 2026, ahead of Microsoft at $565.2 billion, Google at $433.1 billion, Amazon at $369.9 billion and NVIDIA at $184.3 billion (Brand Finance, Global 500 2026, 2026).
- Kantar BrandZ puts Google first at $1.5 trillion, then Apple at $1.4 trillion and Microsoft at $1.1 trillion, while Interbrand ranks Apple first at $514.6 billion (Kantar BrandZ, Most Valuable Global Brands 2026, 2026; Interbrand, Best Global Brands 2026, 2026).
- In 2023, Brand Finance had Amazon on top at $299.3 billion despite a 15% fall, with BYD the fastest-growing brand at 57% (Brand Finance, Global 500 2023, 2023). In 2026 Revolut grew fastest, up 239% to $6.6 billion (Brand Finance, Global 500 2026, 2026).
- YouTube is the world’s strongest brand, with a Brand Strength Index score of 95.3 out of 100, ahead of WeChat at 95.1 and Microsoft at 94.7 (Brand Finance, Global 500 2026, 2026).
Total Brand Value by Ranking and Country
American brands hold more than half of global brand value, and the total grew 11% in a single year.
- The Global 500 is worth $10.4 trillion in 2026, up 11% from $9.5 trillion, and the top 10 brands hold 27% of that value (Brand Finance, Global 500 2026, 2026).
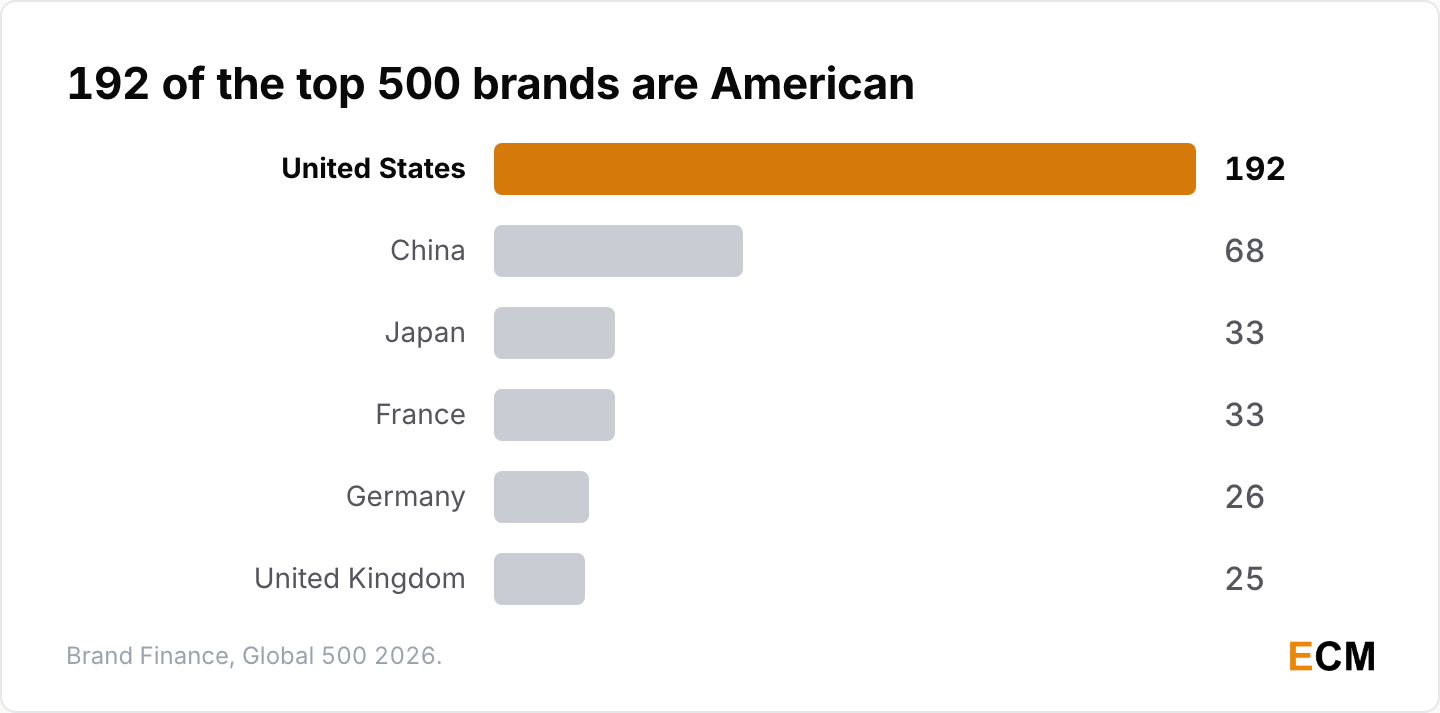
- 192 US brands account for more than half of the Global 500’s value and 68 Chinese brands for just over 15%; Japan and France have 33 brands each, Germany 26 and the UK 25 (Brand Finance, Global 500 2026, 2026). In 2023 the US had over 200 brands and half of total value (Brand Finance, Global 500 2023, 2023).
- Kantar’s BrandZ Top 100 is worth $13.1 trillion, up 22% year on year (Kantar BrandZ, Most Valuable Global Brands 2026, 2026), and the 100 most valuable tech brands are worth $3.7 trillion, up 15% (Brand Finance, Technology 100 2026, 2026).
Does Branding Increase Revenue and ROI?
Strong brands have beaten the stock market for two decades, which is the cleanest answer I know to “is branding worth paying for?”
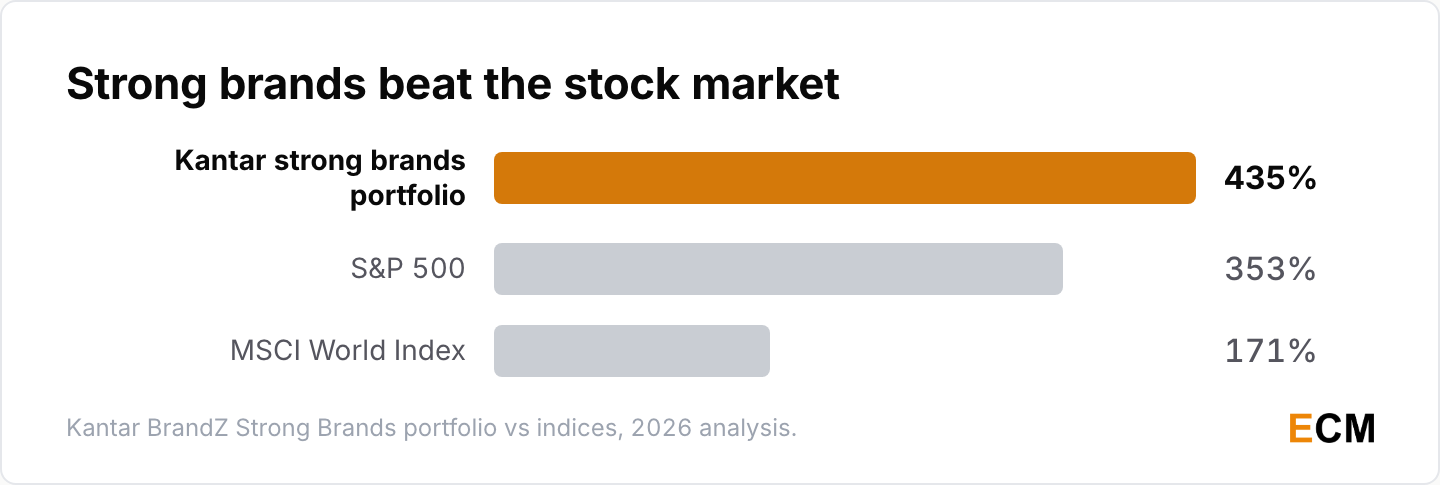
- A portfolio of Kantar’s strong brands returned 435% from April 2006 to March 2025, against 353% for the S&P 500 and 171% for the MSCI World Index (Kantar, BrandZ enterprise value analysis, 2026).
- Intangible brand assets make up 33% of a company’s market value on average, yet fewer than half of marketers say their leadership dashboards include brand metrics (Kantar, Getting the B-word to the C-suite, 2025).
- Binet and Field’s IPA research puts the most effective budget split at 60:40 between brand building and sales activation, and 62:38 in the IPA’s later Effectiveness in Context report (IPA, The Long and the Short of It, IPA).
- 96% of B2B marketers expected the main effect of their ad campaigns within two weeks, a belief LinkedIn’s B2B Institute calls a myth (LinkedIn, The 95-5 rule, LinkedIn).
Brand Trust Statistics: Why Trust Drives Purchases
Trust is the thread through almost every consumer study on this page. If I had to pick one branding number to quote in a pitch deck, it would be Edelman’s 88%.
Trust Ranks Alongside Value and Quality
Trust is now a purchase criterion on par with quality and value, and most shoppers in Salsify’s latest survey paid extra for a brand they trust.
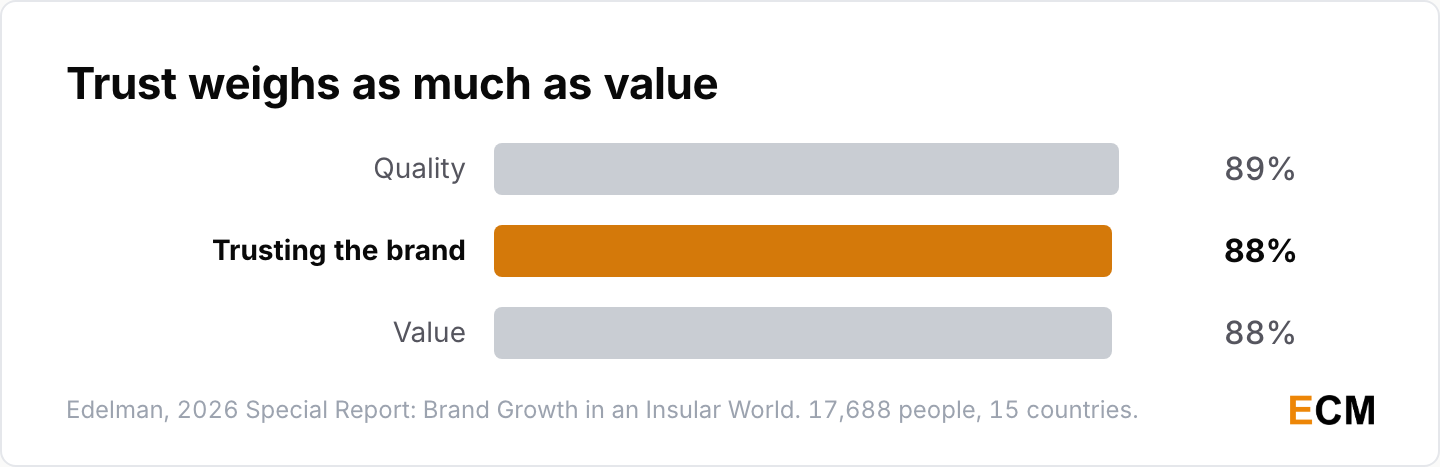
- 88% of consumers say trusting the brand is an important or critical purchase criterion, level with value at 88% and close to quality at 89%, across 17,688 people in 15 countries (Edelman, 2026 Special Report: Brand Growth in an Insular World, 2026).
- 68% of 2,712 shoppers in the US, UK and Canada paid more for a product in the past year because they trusted the brand: 82% in the US, 61% in the UK and 60% in Canada (Salsify, 2026 Consumer Research Report, 2026). Salsify’s 2025 report, which covered the US and UK only, had 87% of shoppers saying they have ever paid more for a product because they trust the brand (Salsify, 2025 Consumer Research Report, 2025), and 55% switched brands for a better deal in its Q4 2025 pulse survey (Salsify, Q4 2025 Ecommerce Pulse Report, 2025).
- In 2022, 59% said some brands are worth paying more for because they’ve earned their trust, and 59% said they’d soon stop buying unless they trusted the company behind a product (Edelman, 2022 Special Report: The New Cascade of Influence, 2022).
Who Consumers Believe Before They Buy
People trust their own experience and other customers more than anything a brand says about itself. My online review statistics page goes deeper on reviews.
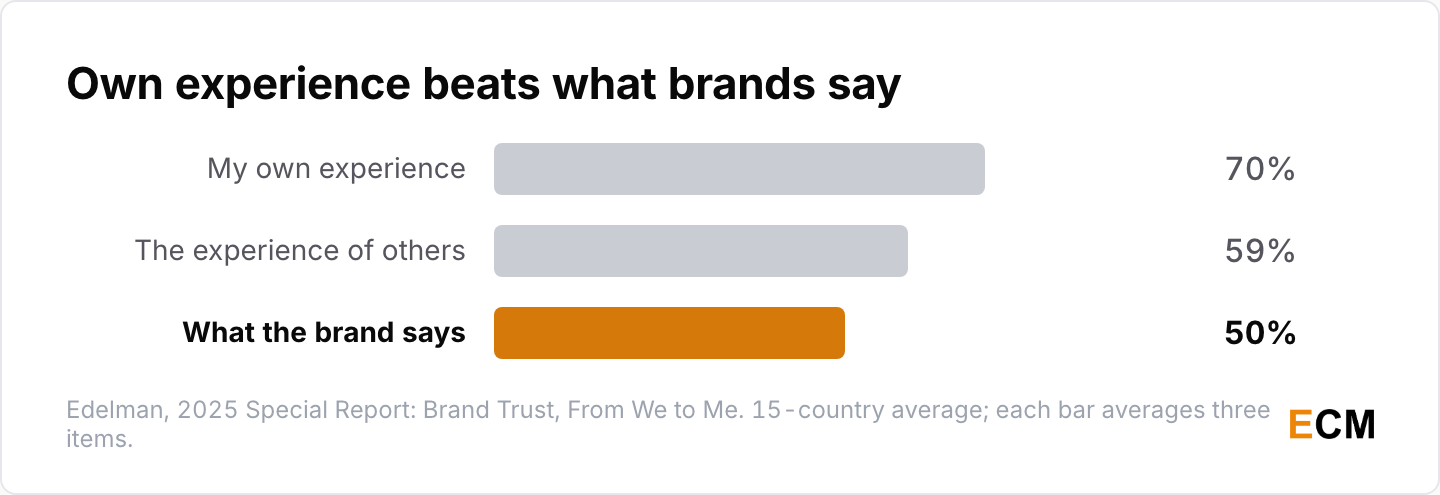
- Before buying, 70% say their opinion of a brand is at least moderately influenced by their own experience, 59% by other people’s experience and 50% by what the brand says (each an average across three items), and 53% assume a brand that says nothing about societal issues is doing nothing or hiding something (Edelman, 2025 Special Report: Brand Trust, From We to Me, 2025).
- In January 2021, 63% of Americans trusted brands more than traditional media outlets and 65% preferred to buy from brands that match their values, but only 26% trusted influencers promoting a brand’s products (Contently, What Buyers Want From Content Marketing, 2021).
- 97% of shoppers say fake reviews make them lose trust in a brand, and 75% worry about running into them (Bazaarvoice, the authenticity crisis, 2025).
Brand Values, Purpose and Social Issues
Most consumers buy, choose or avoid brands based on their beliefs, and younger buyers want those values visible at checkout.
- 64% of consumers buy, choose or avoid brands based on their beliefs about society, up 4 points since 2024, and 73% say a brand that authentically reflects today’s culture would do more to raise their trust than one that ignores culture (Edelman, 2025 Special Report: Brand Trust, From We to Me, 2025).
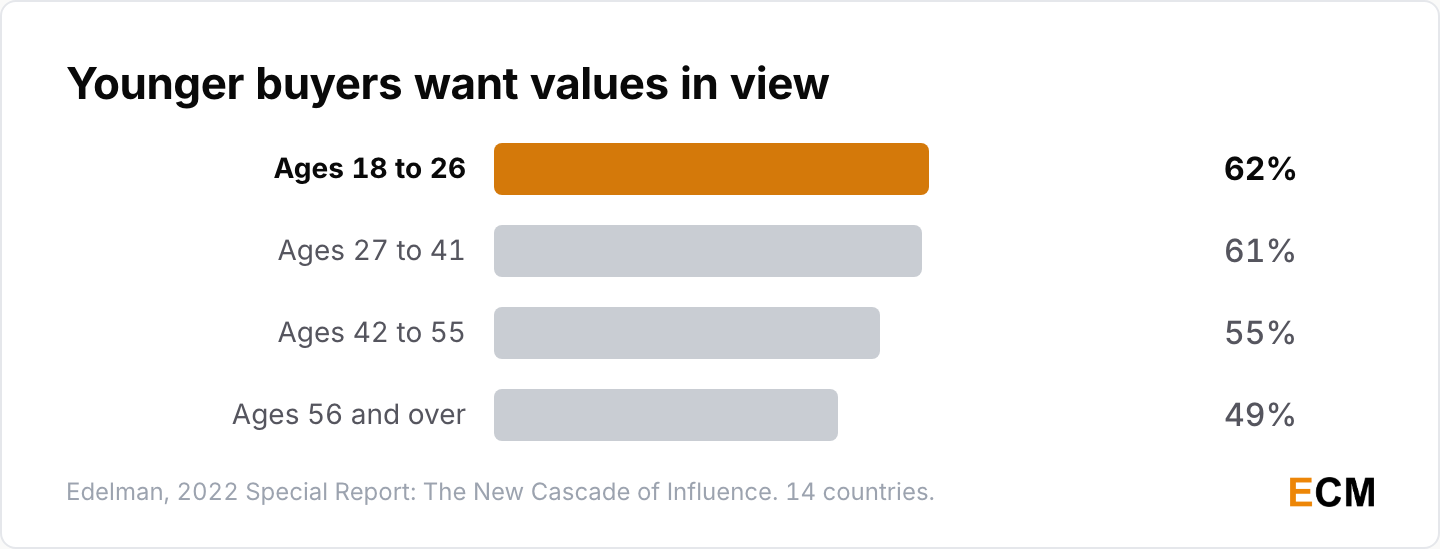
- 57% want brands to make their values easier to see at the moment of purchase, rising to 62% of 18 to 26 year olds and 61% of 27 to 41 year olds, against 55% of 42 to 55 year olds and 49% of those 56 and over (Edelman, 2022 Special Report: The New Cascade of Influence, 2022).
- 59% said brands are obligated to take a stand on issues that affect their customers, and 60% on issues that affect their employees (Edelman, 2022 Special Report: The New Cascade of Influence, 2022). In 2021, 75% said it’s critical or important that a brand treats its employees well (Edelman, Trust: The New Brand Equity, cited in the 2022 report, 2021).
- In a survey of nearly 30,000 consumers, 63% preferred to buy from companies that stand for a shared purpose reflecting their values, and 65% said a company’s leaders influence what they buy (Accenture, From Me to We: The Rise of the Purpose-led Brand, 2018).
Brand Authenticity Statistics and User-Generated Content
Authenticity is the trust question asked a different way. Stackla’s 88% in 2021 and Getty’s 87% in 2024 point the same way.
How Much Authenticity Matters to Consumers
Authenticity has topped consumer wish lists since at least 2021, and buyers can hear when a brand sounds like an ad.
- 88% of consumers said authenticity is important when deciding which brands they like and support, and 50% called it very important, in a survey of 2,042 consumers in the US, UK and Australia (Stackla, Post-Pandemic Shifts in Consumer Shopping Habits, 2021).
- In Getty’s report drawing on 30,000+ adults in 25 countries surveyed from 2022 to 2024, 98% agree authentic images and videos are key to building trust, and 87% say it’s important for an image to be authentic (Getty Images, AI image transparency report, 2024).
- Half of consumers want brands to stop sounding salesy and corporate and start sounding authentic and relatable (Sprout Social, The State of Social Media, 2026).
User-Generated Content and Purchase Decisions
Customer photos, reviews and videos moved more buyers than branded content in 2021, and 65% of shoppers still relied on them in 2024.
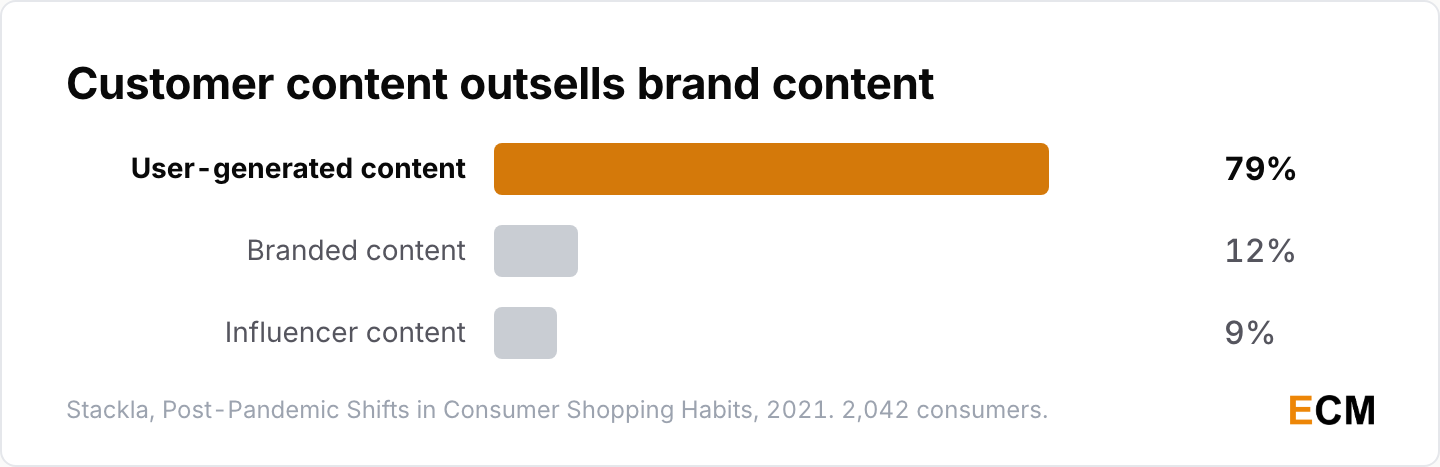
- 79% of people say user-generated content highly impacts their purchasing decisions, against 12% for branded content and 9% for influencer content, and 59% call UGC the most authentic type of content (Stackla, Post-Pandemic Shifts in Consumer Shopping Habits, 2021).
- 66% of consumers say they’ve been inspired to buy from a new brand after seeing other consumers’ social images, 56% are more influenced by social images and videos than before the pandemic, and 47% of Gen Z are more likely to keep engaging with a brand that shares their photo or video (Stackla, Post-Pandemic Shifts in Consumer Shopping Habits, 2021).
- 65% of global shoppers rely on UGC such as ratings, reviews, photos and videos when they buy, and 80% of Gen Z say it’s key to their decisions (Bazaarvoice, Shopper Experience Index Vol. 18, 2024).
AI-Generated Content and Brand Trust
Marketers adopted AI faster than consumers accepted it, and the gap shows up in purchase intent. My brand voice AI statistics page tracks the marketer side.
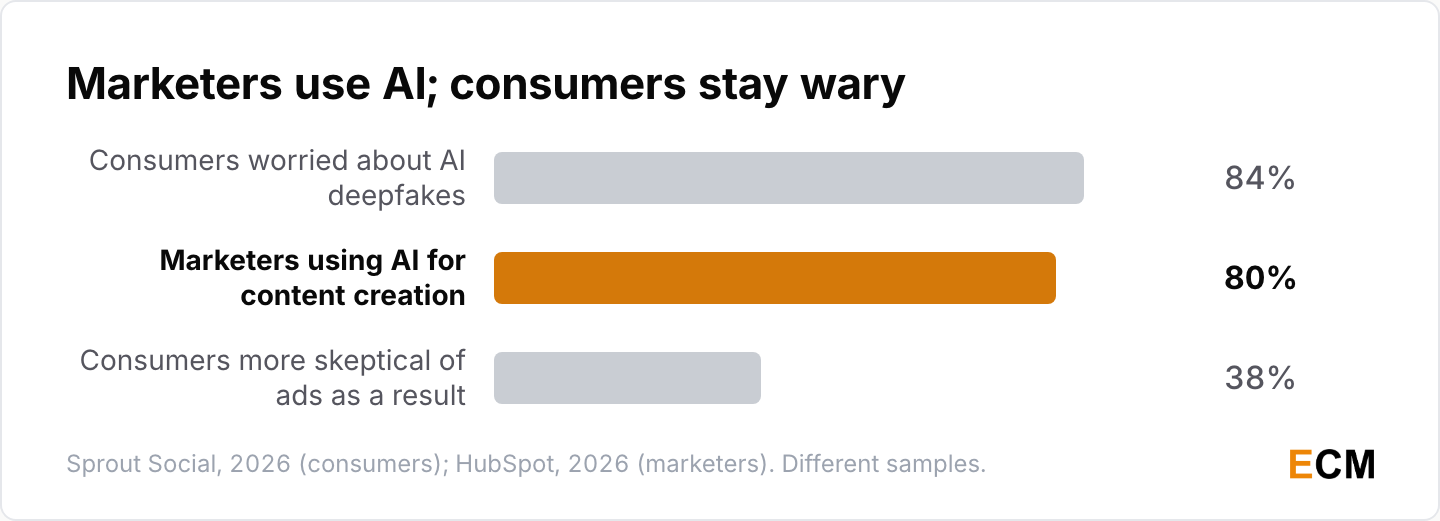
- 80% of marketers use AI for content creation and 75% use it for media production (HubSpot, 2026 State of Marketing, 2026).
- 84% of consumers worry about running into AI-generated deepfakes, and 38% say that worry makes them more skeptical of ads in general (Sprout Social, The State of Social Media, 2026).
- Almost 90% of consumers want to know whether an image was created with AI (Getty Images, AI image transparency report, 2024).
Social Media Branding Statistics: Discovery, Search and Care
Social has become a search engine, a store and a help desk for brands at once. Search still leads brand discovery overall, with TV ads and social ads about a point and a half behind.
Social Media as a Brand Discovery Channel
Search engines are still the top way people find new brands, but more than half of Instagram, TikTok and Facebook users follow or research brands there.
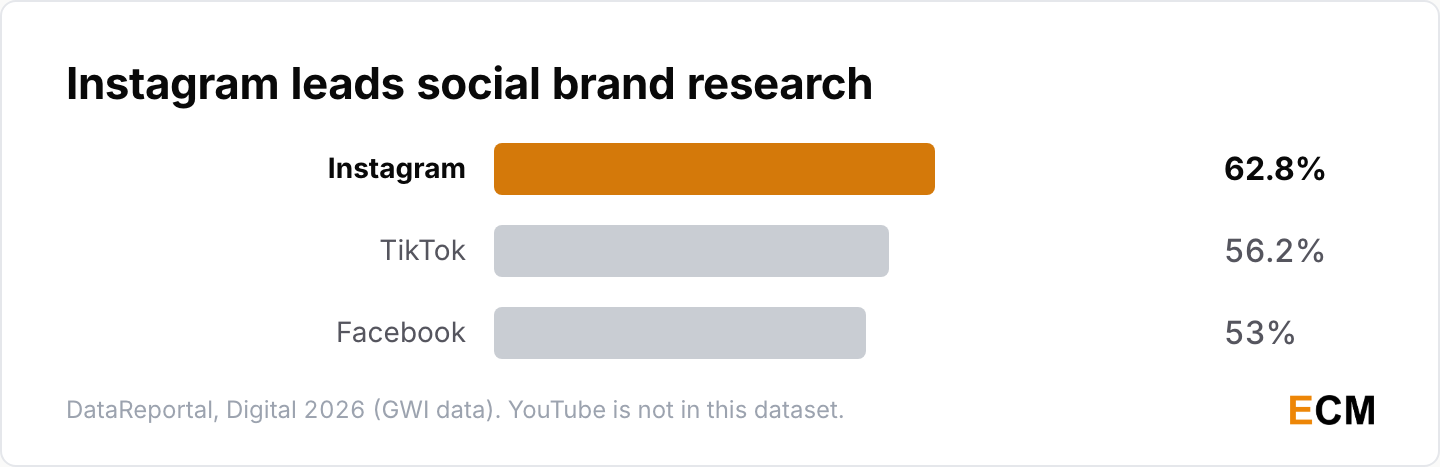
- 62.8% of Instagram’s active users use it to follow brands or research brands and products, ahead of TikTok at 56.2% and Facebook at 53% (DataReportal, Digital 2026: 2 in 3 people use social media, 2025). In Digital 2025, the order was Instagram 62.3%, Facebook 52.5% and TikTok 51.5%, with TikTok up from 37.9% at the start of 2023 (DataReportal, Digital 2025 Global Overview, 2025).
- 32.0% of online adults discovered new brands through search engines in Q2 2026, the top source, ahead of TV ads at 30.6% and social media ads at 30.4% (DataReportal, Digital 2027 Global Overview, 2026). Digital 2025 had search at 32.8% and TV ads at 32.3% (DataReportal, Digital 2025 Global Overview, 2025).
- In 2022, more than 4 in 10 working-age internet users visited social networks to research brands they were thinking of buying, rising to half of 16 to 24 year olds (DataReportal, Digital 2022 Global Overview, 2022). By Q2 2026, 41.8% of online adults used social networks to research brands against 45.3% for search engines, and monthly search engine use had slipped from 82.8% to 80.3% in two years (DataReportal, Digital 2027 Global Overview, 2026).
How Gen Z Discovers and Buys From Brands
Gen Z treats social as a search engine and a shopping channel, and trusts it more than Google for brand information.
- 41% of Gen Z turn to social media first when searching for information online, and 37% of all consumers start product research on social (Sprout Social, social media search, 2025).
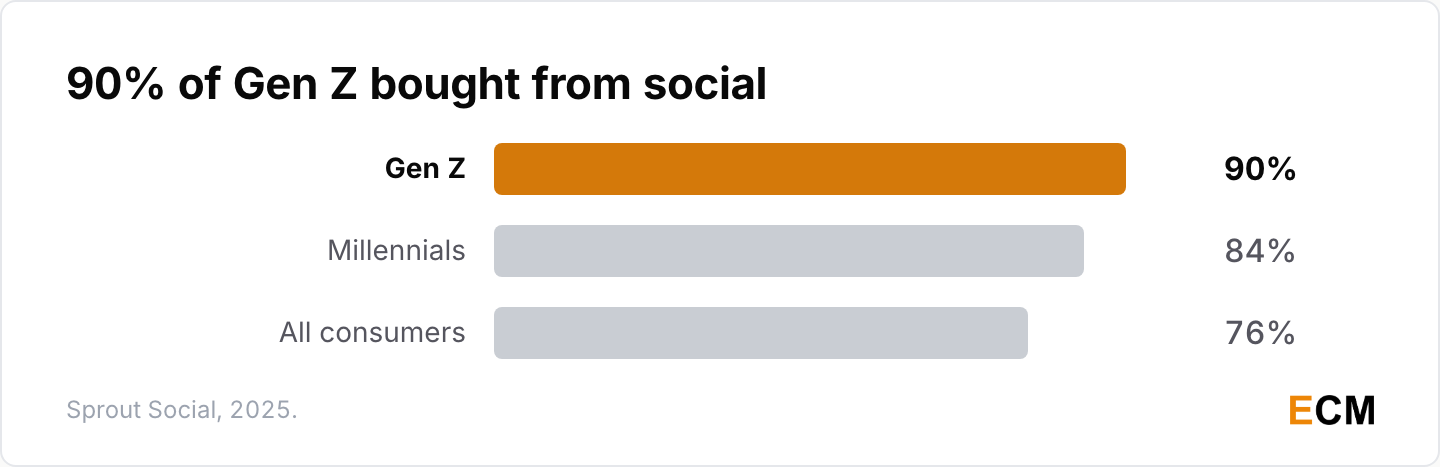
- 76% of consumers bought something in the last six months because of content they saw on social, rising to 84% of Millennials and 90% of Gen Z (Sprout Social, social media search, 2025).
- 52% of Gen Z trust brand or product information on social media more than information from Google or AI chatbots (Sprout Social, social media statistics, 2026).
Social Customer Care and Messaging
People expect brands to answer on social within a day, and silence sends them to competitors.
- 73% of social users say they’ll buy from a competitor if a brand doesn’t respond on social (Sprout Social, social media customer service statistics, 2025).
- 68% of consumers expect a reply within 24 hours, and 55% would rather message a company privately than complain in public (Sprout Social, The State of Social Media, 2026).
- Hootsuite’s 2022 report cited a Nielsen survey for Facebook in which 64% of people preferred to message rather than call a business and 60% were open to personal messages from companies; 59% of Hootsuite’s own respondents said social customer care had grown in value for their organization (Hootsuite, Social Trends 2022, 2022).
Branded Content, Newsletters and Small Business Social
Brand content reaches most people, though small businesses rate the oldest platforms as the least effective.
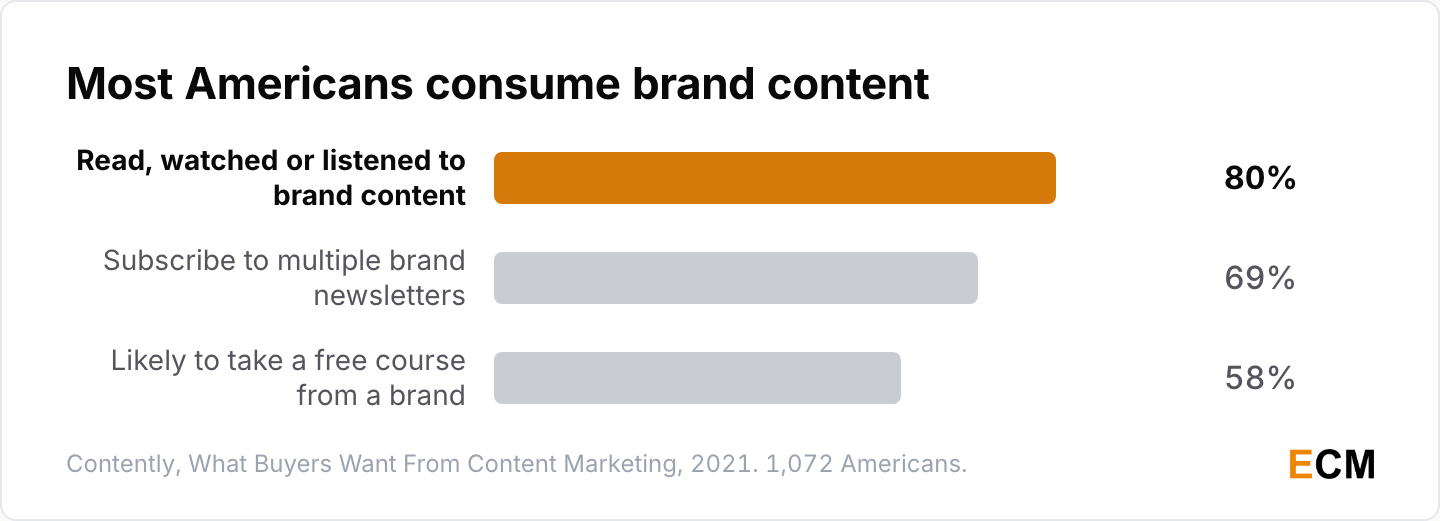
- 80% of Americans read, watched or listened to content from a brand in the past year, 69% subscribe to multiple brand newsletters and 69% follow a brand on social media (Contently, What Buyers Want From Content Marketing, 2021).
- 58% said they’re somewhat or very likely to take a free course from a brand (Contently, What Buyers Want From Content Marketing, 2021). More on that in my content marketing statistics.
- Of 800 small business owners, 62% were active on Facebook but only 24% said it was highly effective (Hootsuite, Social Trends 2022, 2022).
Brand Loyalty and Customer Experience Statistics
Loyalty is where brand trust turns into revenue. CX scores began recovering in North America in 2026, and the personalization data shows where the gap still sits.
Customer Experience Hit a 2025 Low, Then Started Recovering
Forrester’s North American CX Index dropped four years running through 2025, and the 2026 recovery is mostly confined to the US and Canada.
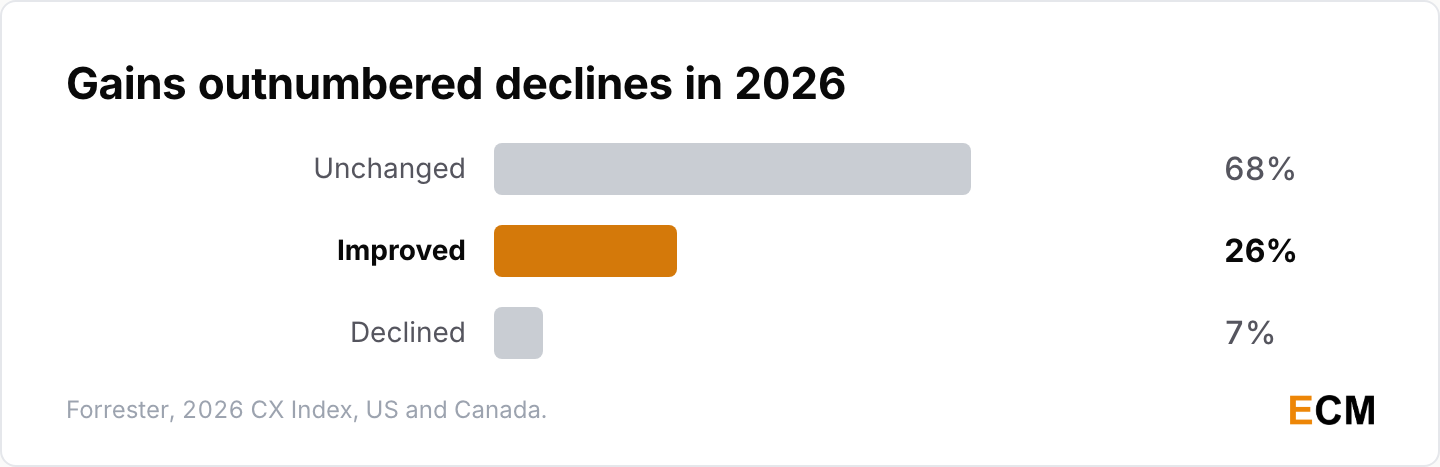
- In 2026, 26% of US and Canadian brands made statistically significant gains, 7% declined and 68% were unchanged (Forrester, 2026 CX Index, 2026). That followed a fourth consecutive fall to an all-time low in 2025, when 25% of US brands had significant losses and 7% improved (Forrester, CX Index 2025 results, 2025).
- Globally, 20% of brands rated in both years improved in 2026 and 8% declined (Forrester, 2026 Total Experience Score release, 2026). In 2025, 6% improved, 21% declined and 73% held steady, across more than 275,000 customers and 469 brands (Forrester, Global CX Index 2025 rankings, 2025).
- In 2022 the US index dipped from 72.0 to 71.3 across 221 brands, investment firms rose from 72.6 to 73.2, and the top 5% of brands delivered 15 percentage points more emotionally positive experiences, 26% versus 11% (Forrester, US CX Index 2022, 2022).
Brand Loyalty and Recommendation Statistics
Good experiences turn into recommendations and repeat purchases, and one bad experience costs spend fast.
- 85% of consumers are more likely to keep doing business with a brand that has a loyalty program, and 73% spend more as a result (Bond, The Loyalty Report 2026, 2026). In 2024, 79% were more likely to recommend brands with solid loyalty programs (Bond, The Loyalty Report 2024, 2024).
- Qualtrics’ 2026 report puts consumers’ likelihood to trust an organization at 76%, to recommend it at 72% and to purchase more at 70%, and satisfied consumers are four times more likely to recommend (Qualtrics, 2026 Consumer Experience Trends, 2026). Its 2024 study had 73%, 70% and 69% after recent interactions (Qualtrics XM Institute, Consumer Satisfaction and Loyalty 2025, 2025).
- 59% of consumers bought from new brands after the pandemic began and 75% of them planned to keep buying, while 61% said they’d be more loyal if invited into a customer advocate community (Stackla, Post-Pandemic Shifts in Consumer Shopping Habits, 2021).
Personalization and Brand Loyalty
Personalization lifts purchase intent sharply, but fewer than half of brands deliver it and fewer than half of consumers feel understood.
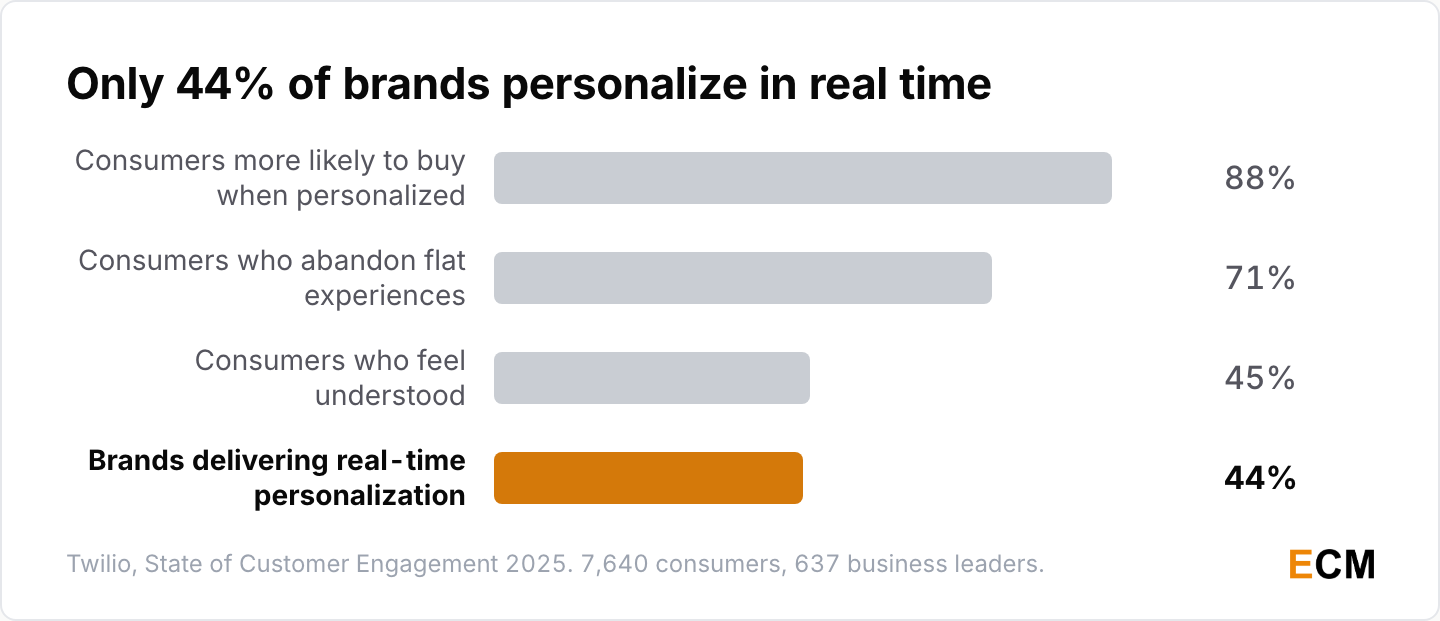
- 88% of consumers are more likely to buy when engagement is personalized in real time, but only 44% of brands say they deliver that (Twilio, State of Customer Engagement 2025, 2025).
- 71% abandon purchases when experiences fall flat, only 45% feel understood by the brands they deal with, and 61% don’t believe brands use their data in their best interest (Twilio, State of Customer Engagement 2025, 2025).
- In 2021, 72% said they’re more likely to buy from a brand that consistently provides a personalized experience (Stackla, Post-Pandemic Shifts in Consumer Shopping Habits, 2021).
B2B Branding and Employer Branding Statistics
B2B buyers and job seekers both make up their minds before anyone from the company calls them. That’s the case for brand work in both places.
B2B Buyers Choose Brands Before Sales Calls
Most B2B deals are decided before the buyer talks to a vendor, so brand familiarity does the early selling. My B2B buyer statistics cover the full buying journey.
- 95% of potential B2B buyers aren’t ready to buy today, which LinkedIn’s B2B Institute calls the 95-5 rule (LinkedIn B2B Institute, The 95-5 Rule, LinkedIn).
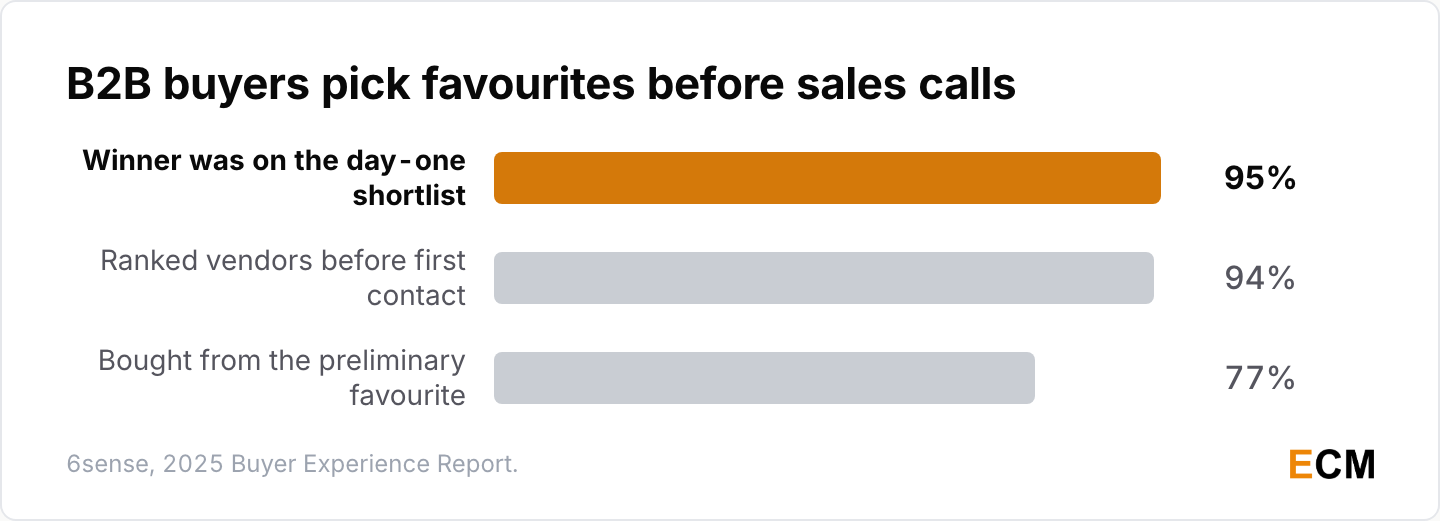
- The winning vendor was on the buyer’s day-one shortlist 95% of the time in 2025, up from 85% in earlier years (6sense, 2025 Buyer Experience Report, 2025).
- 94% of buying groups ranked their preferred vendors before first contact, and they bought from that preliminary favourite 77% of the time (6sense, 2025 Buyer Experience Report press release, 2025).
Thought Leadership as B2B Brand Building
Thought leadership reaches the hidden buyers that sales never meets, and they trust it more than product sheets.
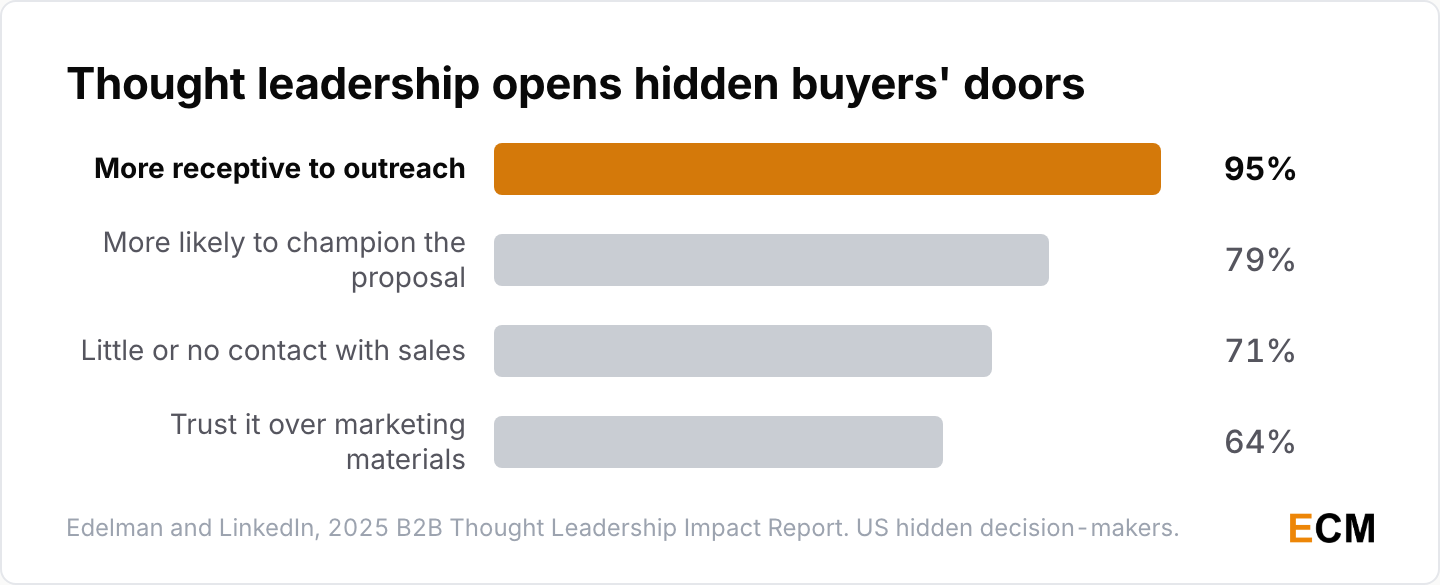
- 95% of US hidden decision-makers say strong thought leadership makes them more receptive to sales and marketing outreach, and 79% are more likely to champion that vendor’s proposal (Edelman and LinkedIn, 2025 B2B Thought Leadership Impact Report, 2025).
- 71% of US hidden decision-makers have little or no interaction with sales, and 64% of US hidden decision-makers trust thought leadership more than marketing materials and product sheets (Edelman and LinkedIn, 2025 B2B Thought Leadership Impact Report, 2025).
- 75% of decision-makers say a piece of thought leadership led them to research a product they weren’t considering, yet only 15% rate its overall quality as very good (LinkedIn, Edelman-LinkedIn B2B Thought Leadership research, 2024).
Employer Branding and Personal Brand Statistics
Employees trust their employer more than any other institution, which makes employee and executive voices a brand asset. If you’re building your own, start with my personal brand statement examples.
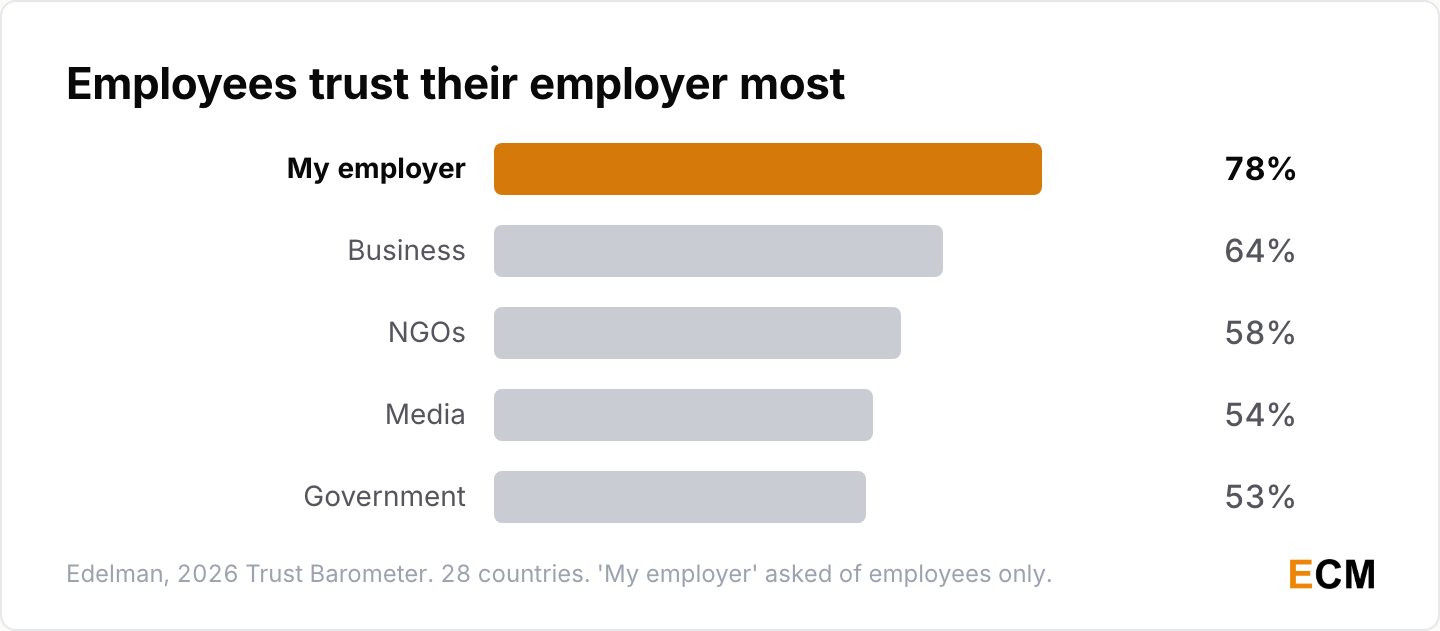
- 78% of employees trust their employer, while the general public’s trust stands at 64% for business, 58% for NGOs, 54% for media and 53% for government, across 28 countries (Edelman, 2026 Trust Barometer, 2026).
- LinkedIn found that companies with a strong employer brand saw a 43% decrease in cost per hire (LinkedIn Talent Solutions, employer brand research, 2016), and 86% of employees in LinkedIn’s employee advocacy program said sharing content helped their careers (LinkedIn, employee content sharing, 2017).
- The share of organizations that wanted to use social media to improve the employee experience jumped from 4% to 20% in a year, and the share wanting it for brand protection and risk mitigation from 5% to 20% (Hootsuite, Social Trends 2022, 2022).
Frequently Asked Questions
What are the most important branding statistics in 2026?
The ones I’d quote first: 88% of consumers treat trust in a brand as a key purchase criterion (Edelman, 2026 Special Report: Brand Growth in an Insular World, 2026), 68% of US, UK and Canadian shoppers paid more in the past year for a brand they trust (Salsify, 2026 Consumer Research Report, 2026), and the top 500 brands are worth $10.4 trillion (Brand Finance, Global 500 2026, 2026).
Are brands worth it?
The market data says yes. Kantar’s strong-brand portfolio returned 435% between April 2006 and March 2025, against 353% for the S&P 500 (Kantar, BrandZ enterprise value analysis, 2026). Intangible brand assets average 33% of a company’s market value (Kantar, Getting the B-word to the C-suite, 2025).
How does brand consistency affect recognition?
Marq, the design platform formerly called Lucidpress, reports that consistently presented brands are 3 to 4 times more likely to enjoy brand visibility (Marq, brand statistics, Marq). Consistent personalization also moves purchases: 72% of consumers said they’re more likely to buy from a brand that consistently provides a more personalized experience (Stackla, Post-Pandemic Shifts in Consumer Shopping Habits, 2021).
What is the importance of color in brand recognition?
Color increases brand recognition by up to 80%, according to a University of Loyola, Maryland study cited by the color consultancy Colorcom (Colorcom, Why Color Matters, Colorcom). It’s one of the most repeated branding figures online, so I’d quote it with that attribution.
How much time does it take for a consumer to form an impression based on visual appeal?
About 50 milliseconds. Lindgaard and colleagues found people judge a website’s visual appeal within 50 milliseconds of seeing it (Lindgaard et al., Behaviour & Information Technology, 2006).
Why does branding matter for B2B companies?
95% of potential B2B buyers aren’t in the market at any moment (LinkedIn B2B Institute, The 95-5 Rule, LinkedIn), and the eventual winner sat on the day-one shortlist 95% of the time in 2025 (6sense, 2025 Buyer Experience Report, 2025). Brand work puts you on that list before the buyer is ready.
How does employer branding affect hiring?
LinkedIn found companies with a strong employer brand saw a 43% decrease in cost per hire (LinkedIn Talent Solutions, employer brand research, 2016). Trust helps too: 78% of employees trust their employer (Edelman, 2026 Trust Barometer, 2026).
Written by
Editorial Staff
The Editorial Staff represents the writers, editors, and content creators who have worked (or work) at Elite Content Marketer. The experimenter-in-chief behind the team is Chintan Zalani, who has close to a decade of experience trying to make sense of the content marketing industry. Started in 2019, Elite Content Marketer is on a mission to help creators build sustainable businesses.
Related Articles

Marketing Data
EdTech Market Statistics 2026: 60 Funding and AI Facts
60 edtech market statistics for 2026: market size, venture funding, Duolingo and Coursera results, school device use, AI adoption and cybersecurity data.
Nov 3, 2026Read more →

Marketing Data
Web Hosting Statistics 2026: 60 Facts on Market Size
60 web hosting statistics for 2026: a $150.2B market, Shopify and Hostinger lead site share, AWS holds 26% of cloud, and WordPress runs 39.5% of sites.
Oct 30, 2026Read more →

Marketing Data
Live Streaming Statistics 2026: 59 Facts and Trends
59 live streaming statistics for 2026: 31.7B hours watched in Q3, YouTube Live’s 60.3% share, Kick’s 131% growth, live shopping and webinar data.
Oct 28, 2026Read more →