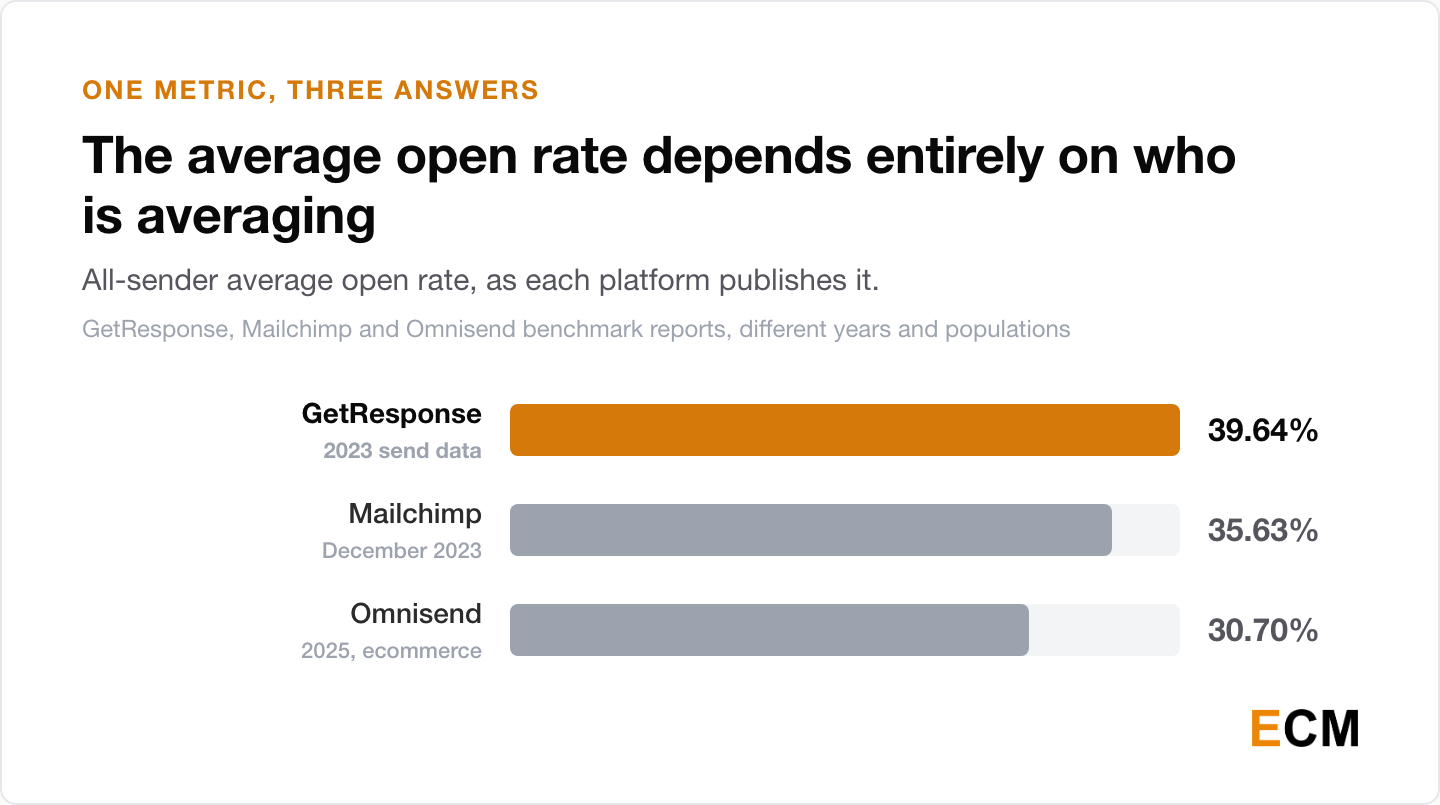
Three platforms publish an all-sender average open rate and they disagree by nine points: GetResponse 39.64%, Mailchimp 35.63%, Omnisend 30.7%. None is wrong, they just count opens differently, which is why email marketing stats rarely compare cleanly.
75 Email Marketing Stats for 2026: Open Rates and ROI
 Written by Editorial Staff
Key Takeaways
- There is no single average open rate. Three platforms report between 30.7% and 39.64% on the same headline metric, measured in different years across different populations. The spread is definitional, not behavioral, and Apple’s Mail Privacy Protection adds distortion on top of it.
- The famous “$42 for every $1” figure has a birthday, and it is not the one usually quoted. It is £42.24, measured in 2018 and published in the DMA’s 2019 Marketer Email Tracker, a survey of 197 UK marketers. Litmus put the same measure at 42:1 in 2019 and 36:1 in 2020.
- Automation is the steadiest finding here. Omnisend’s automated emails were 2% of sends and 30% of email revenue in 2025, earning 16 times more per message than scheduled campaigns, and its 2024 data showed the same shape.
- Apple decides what an “open” means now. Apple Mail accounts for 62.26% of tracked opens, and Litmus reports Mail Privacy Protection affecting roughly 55-60% of all opens.
- Authentication stopped being optional. Gmail, Yahoo, and Microsoft all now require SPF, DKIM, and DMARC from bulk senders, and Microsoft hardened its penalty six days before the deadline, dropping the junk-folder grace period it had announced in favour of outright rejection.
- AI usage intent is high and self-reported. 94% of marketers plan to use AI in content creation in 2026, while 62.7% in the same survey say the market needs more human-centered content to compete with AI-generated volume.
Top Email Marketing Statistics for 2026
Most 2026 email marketing statistics roundups open with a number nobody can source. These four name the study behind them. If you carry four numbers into a planning meeting, carry these.
Four Email Metrics Worth Quoting in 2026
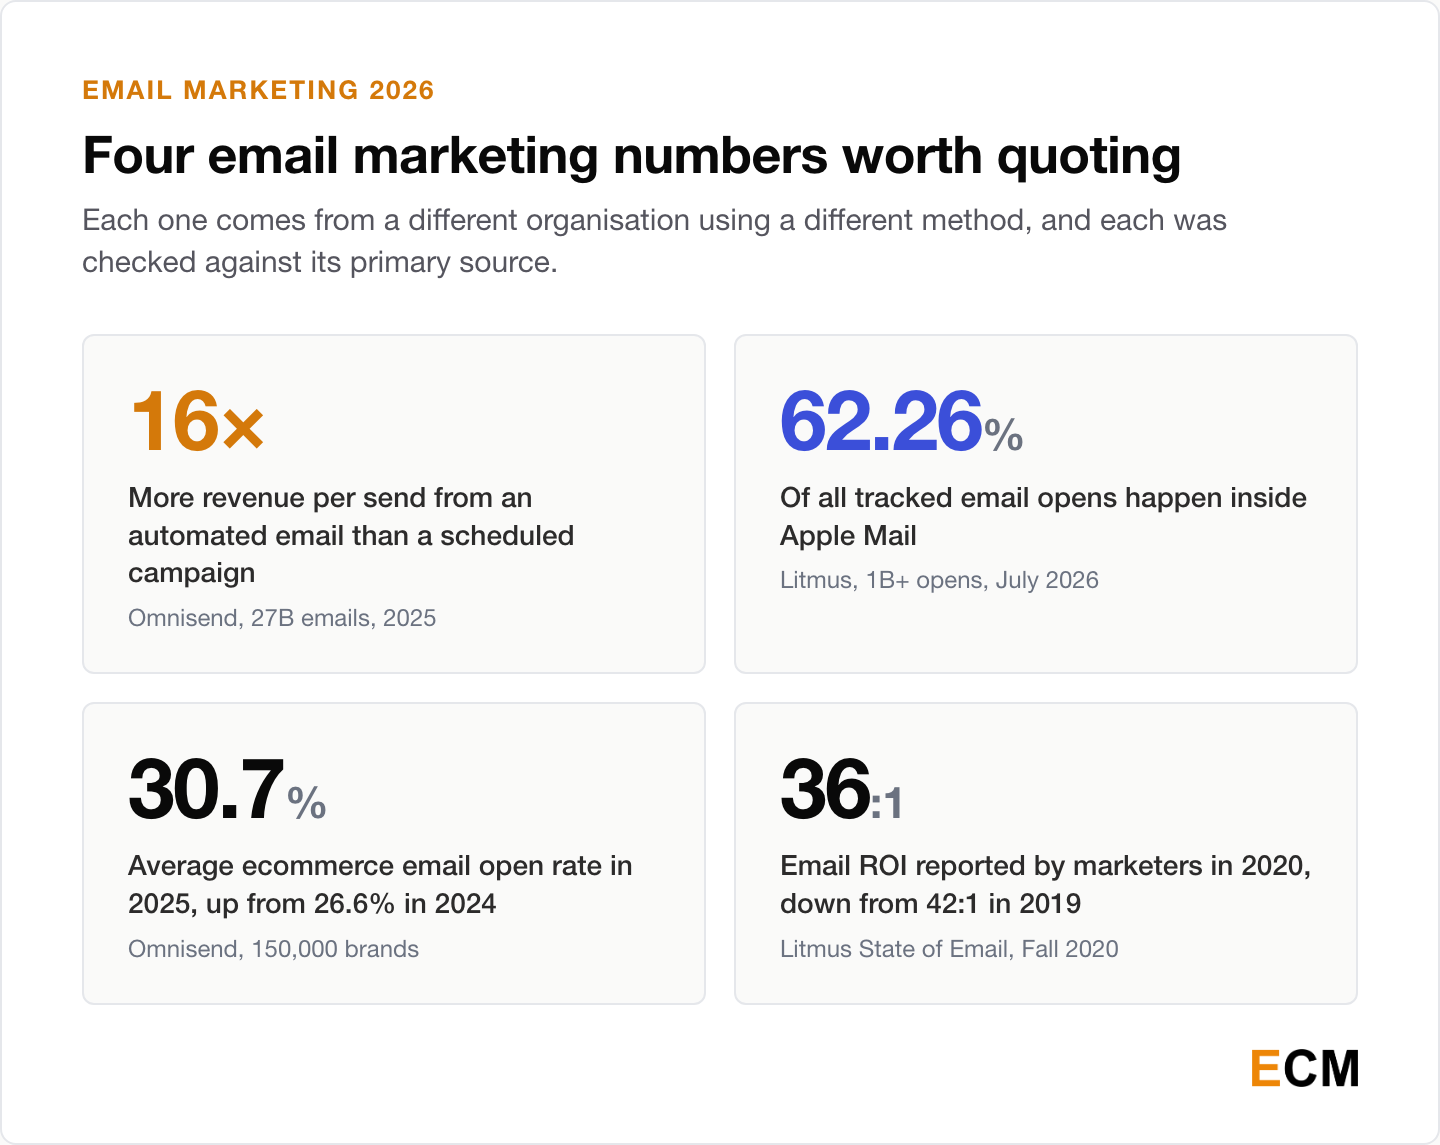
1. Automated emails earned 16 times more revenue per send than scheduled campaigns in 2025, at $2.87 per automated send against $0.18 per campaign send (Omnisend 2026 eCommerce Marketing Report, January 2026; 27 billion emails across 150,000 brands).
2. 62.26% of all tracked email opens happened inside Apple Mail in July 2026, against 27.03% for Gmail (Litmus Email Client Market Share, calculated from over 1 billion opens).
3. The average ecommerce email open rate reached 30.7% in 2025, up from 26.6% in 2024 and rising for the fifth consecutive year (Omnisend 2026 eCommerce Marketing Report).
4. Marketers reported email ROI of 36:1 in 2020, down from 42:1 in 2019 (Litmus State of Email Report, Fall 2020, over 2,000 marketing professionals).
Why These Four Numbers Hold Up
Between them these four use three methods from two organisations: Omnisend’s own send logs, Litmus’ tracking-pixel panel, and a Litmus practitioner survey. Agreement across unrelated methods beats any single headline figure. Stat 4 is dated 2020 because nobody has re-measured email ROI with a primary survey since.
General Email Marketing Statistics for 2026
The audience keeps growing, slowly, and the volume flowing through individual platforms grows faster.
How Many People Use Email
5. Worldwide email users will grow from over 4.4 billion in 2024 to over 4.9 billion by 2028, counting both business and consumer users (The Radicati Group, Email Statistics Report 2024-2028). Radicati is the source almost every “X billion email users” claim traces back to, and its methodology is proprietary rather than externally audited.
Radicati’s press release carries the 2024 and 2028 endpoints. The precise mid-series 2026 figure that circulates widely comes from secondary blogs rather than from Radicati.
6. Gmail’s automated defenses block nearly 15 billion unwanted emails every day and stop more than 99.9% of spam, phishing, and malware from reaching inboxes (Google, October 2023).
How Much Email Gets Sent
7. Omnisend merchants sent 27 billion emails in 2025, alongside 321 million SMS messages and 458 million push notifications, across 150,000 brands (Omnisend 2026 eCommerce Marketing Report).
8. beehiiv publishers sent 28 billion emails in 2025, reaching more than 255 million unique readers (beehiiv State of Newsletters 2026, published January 2026).
9. Global ecommerce order volume across all channels grew 98% year over year in 2025, climbing from +82% in Q1 to a peak of +146% in Q4 (Omnisend 2026 eCommerce Marketing Report).
What the Email Market Is Worth
10. Klaviyo grew revenue 31.6% year over year, from $937.5 million in 2024 to $1,234.0 million in 2025 (Klaviyo Form 10-K, FY2025, filed with the SEC February 2026). This is the only audited financial figure on this page.
11. Klaviyo served over 193,000 customers as of December 31, 2025, up from 167,000 a year earlier (Klaviyo Form 10-K, FY2025).
12. The global email marketing market was valued at $7.5 billion in 2020 and projected to reach $17.9 billion by 2027, a compound annual growth rate of about 13.2% (Statista). This page has carried that projection since 2023. The interim reading puts the market near $12.33 billion in 2024, which is roughly on the original trajectory. Statista’s underlying page sits behind a subscription, so treat the forecast as vendor-modelled.
Email Open Rate and Click-Through Statistics
Email open rate benchmarks are where roundups do the most damage. Each email marketing platform below publishes industry benchmarks from its own send logs. The numbers below are not interchangeable, and I have kept each one attached to the platform that produced it.
Average Open Rates by Platform
13. GetResponse reports a global average open rate of 39.64%, from more than 4.4 billion messages sent by customers with at least 500 contacts (GetResponse Email Marketing Benchmarks, 2023 send data).
14. GetResponse’s open rate rose 12.84 percentage points year over year, and GetResponse splits the credit: partly Apple’s Mail Privacy Protection auto-opens inflating the number, partly genuine engagement gains, which it evidences with rises in click-through and click-to-open rates over the same period.
15. Mailchimp reports an all-industry average open rate of 35.63% with a 2.62% click rate (Mailchimp Email Marketing Benchmarks). Mailchimp’s own page states its data was last updated in December 2023, so this is the oldest benchmark in the group. Mailchimp’s figure was 21.33% when this page last cited it, which is a reminder to re-pull vendor benchmarks rather than trusting a cached number.
16. Constant Contact reported an all-industry average open rate of 30.35% as of May 2022, with independent artists, writers and performers highest at 34.4%, followed by education at 34.1% and travel and tourism at 32.6%. This page has cited those figures since 2023. The knowledge-base URL they came from now returns unrelated content, so they stand as a dated 2022 reading rather than a current benchmark.
Click-Through and Click-to-Open Rates
17. GetResponse reports a global average click-through rate of 3.25% and a click-to-open rate of 8.62% (GetResponse Email Marketing Benchmarks, 2023 send data).
18. Omnisend’s ecommerce click-to-conversion rate rose 53% year over year, from 5.9% to 9.0%, even as click-to-open and click-to-send rates fell (Omnisend 2026 eCommerce Marketing Report). Fewer people clicked, and the ones who did were far likelier to buy.
19. Globally, Mondays see the highest email open rates at nearly 22%, against the lowest at 20.3% on Sundays (Campaign Monitor). A 1.7-point spread across the whole week is a good argument for worrying less about send day than most calendars do.
Email Subject Line Statistics
20. Non-personalized subject lines outperformed personalized ones on GetResponse’s platform, at a 41.87% open rate against 35.78%, and the click-through gap ran the same way at 4.23% against 2.11% (GetResponse Email Marketing Benchmarks, 2023 send data). Personalization in the subject line is one of the few tactics this dataset argues against.
21. Subject lines without emojis drew a 42.23% open rate against 37.5% for those with them, with click-through at 4.16% against 3.32% (GetResponse Email Marketing Benchmarks, 2023 send data).
22. The word “invitation” drove the highest open rate of any phrase GetResponse tracked, at 56.76%, against 23.22% for “unlimited” (GetResponse Email Marketing Benchmarks, 2023 send data). All three of these come from one platform’s send logs rather than a controlled test, so read them as what GetResponse’s senders saw, not as a rule about your list.
Welcome Emails and Email Design
23. In GetResponse’s 2023 send data, welcome emails averaged an 83.63% open rate, a 16.60% click-through rate, and a 19.85% click-to-open rate (GetResponse Email Marketing Benchmarks). That is roughly double the all-campaign open rate on the same platform and the same methodology, which makes it one of the cleaner comparisons available. Our email subject line tester scores a draft line before you send it.
24. 97% of marketers incorporate at least one interactive element in emails, with buttons and CTAs ranked most effective at 35% (Litmus and Validity, State of Email 2025, June 2025).
25. Only 47% of companies incorporate basic accessibility measures such as alt text (Litmus and Validity, State of Email 2025). Accessibility remains the weakest link in email design, and it is the one gap on this list a single afternoon of template work can close.
Email Client Market Share by Opens
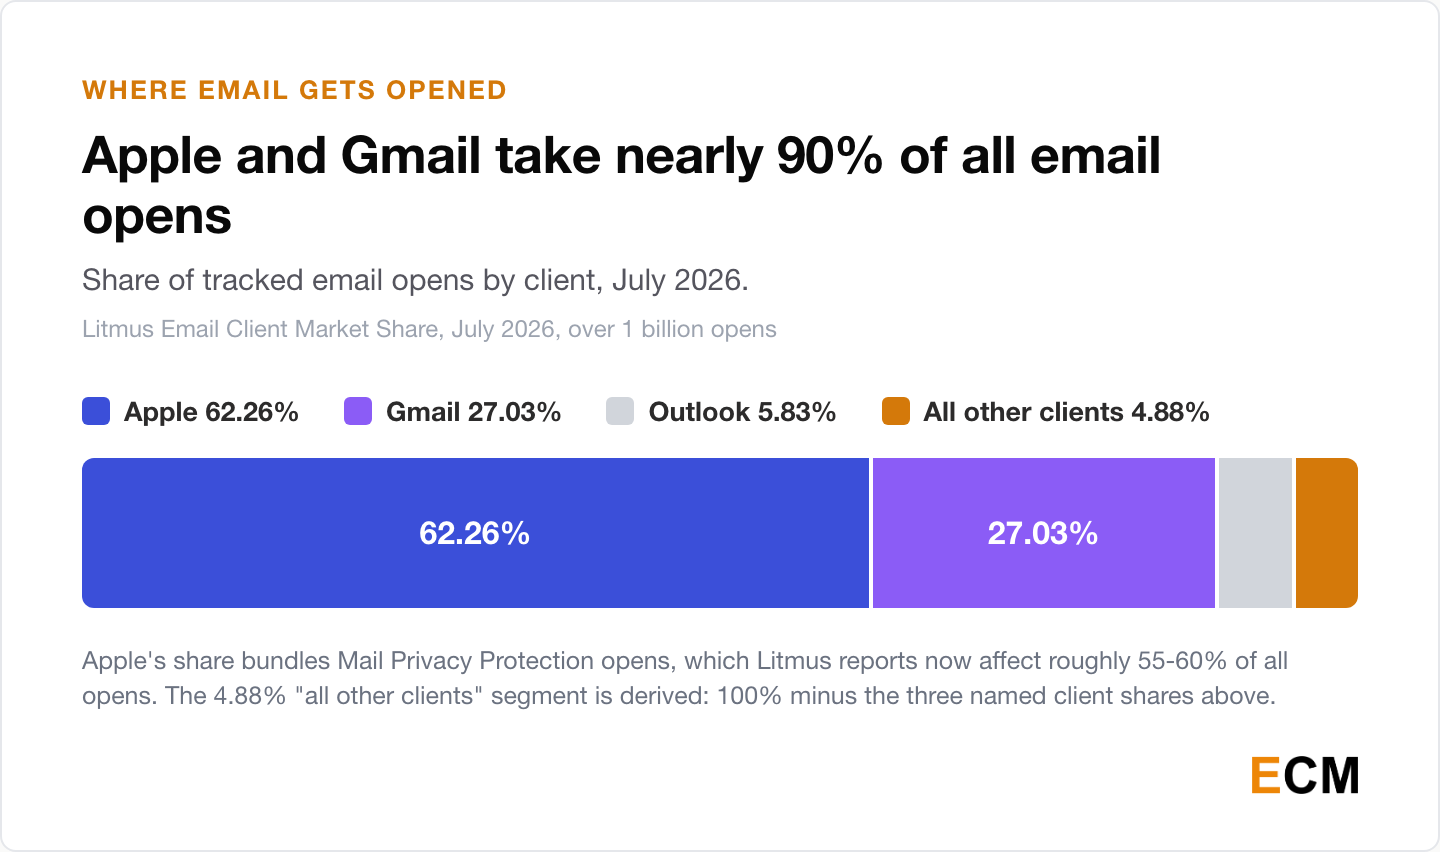
26. Gmail accounted for 27.03% of tracked opens in July 2026 and Outlook for 5.83%, with Yahoo Mail at 2.59% (Litmus Email Client Market Share).
27. Apple Mail and Gmail together take nearly 90% of total email client market share (Litmus Email Client Market Share).
28. Apple’s Mail Privacy Protection now affects roughly 55-60% of all email opens (Litmus Email Client Market Share). This is the single most important caveat on this page. An open rate that includes MPP pre-fetches is measuring Apple’s servers, not your email subscribers.
Email Marketing ROI Statistics by Industry
Return on investment is the noisiest of all email marketing metrics. Email’s reputation as the highest-return channel in digital marketing rests on one UK survey figure for 2018, published in 2019. Here is the whole paper trail.
Where the $42 and $36 Figures Come From
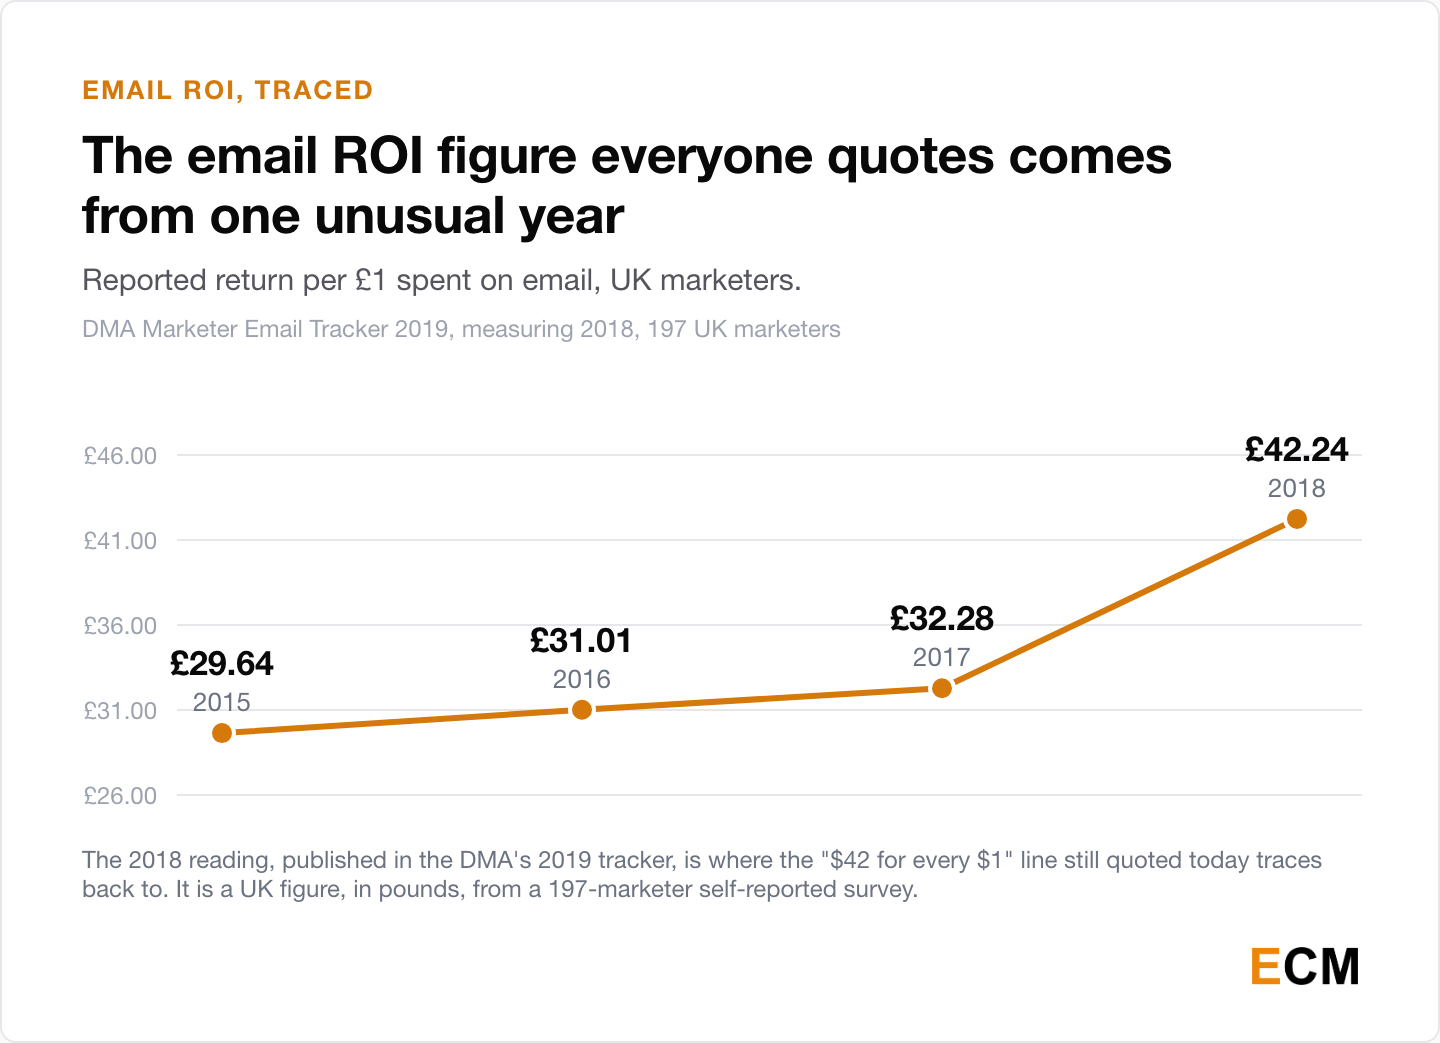
29. UK email ROI stood at £42.24 for every £1 spent in 2018, which the DMA described as “just over £42 for every pound spent” (DMA Marketer Email Tracker 2019, an online survey of 197 UK marketers run in January 2019). This is the origin of the “$42 for every $1” line still circulating in 2026.
Note the two dates: 2019 is the report, 2018 is the year measured. It is a pound figure, from a UK panel, self-reported.
30. The same DMA tracker series shows ROI at £29.64 in 2015, £31.01 in 2016, and £32.28 in 2017, so the move to £42.24 in 2018 was a 31% single-year jump. dotdigital, which sponsored the tracker, singled it out in its foreword: “email ROI has shot up from £32 to £42” (DMA Marketer Email Tracker 2019).
31. Litmus recorded email ROI falling from 42:1 in 2019 to 36:1 in 2020 (Litmus State of Email Report, Fall 2020). Two independent panels land on roughly the same peak, a year apart. Only the Litmus series continues past it, and it recedes. That is about as much corroboration as this metric ever gets.
32. Litmus still cites $36 for every $1 spent as the headline email ROI figure (Litmus 2024 State of Email Trends, page 10). No primary re-measurement has been published since 2020, so quote it with its date attached.
33. Retail, ecommerce and consumer goods reported the highest email ROI at 45:1, ahead of agencies at 42:1, software and technology at 36:1 and media and publishing at 32:1 (Litmus, The ROI of Email Marketing).
This breakdown appears only on that page, not in the downloadable 2020 report, and the page carries two conflicting attributions for the same four numbers: one line credits Litmus’ 2020 State of Email survey of more than 2,000 marketing professionals, another the 2025 survey of nearly 500. The survey behind them is not settled, so quote them without a year.
What Marketers Report About Email ROI
34. 4 out of 5 marketers said they would rather give up social media than email marketing when asked which single tactic they would drop for twelve months (Litmus State of Email Report, Fall 2020). That is a strong result for a marketing channel older than most of the ones it was measured against.
35. 61% of marketers did not have a clear view of their email marketing ROI (Litmus 2021 State of Email). Litmus declined to publish an updated ROI figure the following year, writing that there was not enough confidence in the data to share one.
36. 22% of marketers report struggling with measuring or proving email ROI (Litmus and Validity, State of Email 2025).
Why Email ROI Stays Hard to Measure
Read stats 35 and 36 together. The two figures are 61% in 2021 and 22% in 2025, and it is tempting to read a four-year improvement into them. Do not. They answer different questions, of different panels, and both are vendor-run surveys of self-selected marketers.
Email Automation and Personalization Statistics
The email automation statistics below rest on two consecutive years of Omnisend send data pointing the same way, which makes this the steadiest finding on the page. If you fund a single marketing automation project this year, the numbers point at triggered flows.
Automated Emails Versus Scheduled Campaigns
37. Automated emails made up just 2% of all email sends but generated 30% of total email-driven revenue in 2025 (Omnisend 2026 eCommerce Marketing Report).
38. Automated messages delivered 24% higher open rates, 6 times stronger click engagement, and 19 times higher conversion rates than scheduled campaigns (Omnisend 2026 eCommerce Marketing Report).
39. In the prior year’s data, automated emails drove 37% of email sales from 2% of volume across close to 24 billion emails (Omnisend 2025 eCommerce Marketing Report, 2024 data). The ratio moved, the shape did not.
One caution on stats 1, 37 and 38: they are separate Omnisend measurements, not three views of one calculation. Two percent of sends earning 16 times more per message works out to about 25% of revenue, not the 30% the same report gives. The gap is a rounding and denominator difference in Omnisend’s own reporting. Quote the figures individually rather than deriving one from another.
40. 79% of respondents said they use automation, and over half of those use it for triggered emails, drip or nurture campaigns, and segmentation (Litmus 2021 State of Email). The same report puts triggered emails at 82% of automation use, drip or nurture campaigns at 67% and segmentation at 56%.
A different 79% circulates from the same report, the share putting email in their top three marketing channels, so check which one a roundup is quoting.
Which Automations Earn the Most
41. Abandoned cart and welcome messages together drove 76% of all automation-generated orders (Omnisend 2026 eCommerce Marketing Report).
42. Back-in-stock emails delivered the highest conversion rate of any automation type at 6.46% (Omnisend 2026 eCommerce Marketing Report).
43. Birthday automations produced an average order value of $744.37, more than 4 times the platform average (Omnisend 2026 eCommerce Marketing Report).
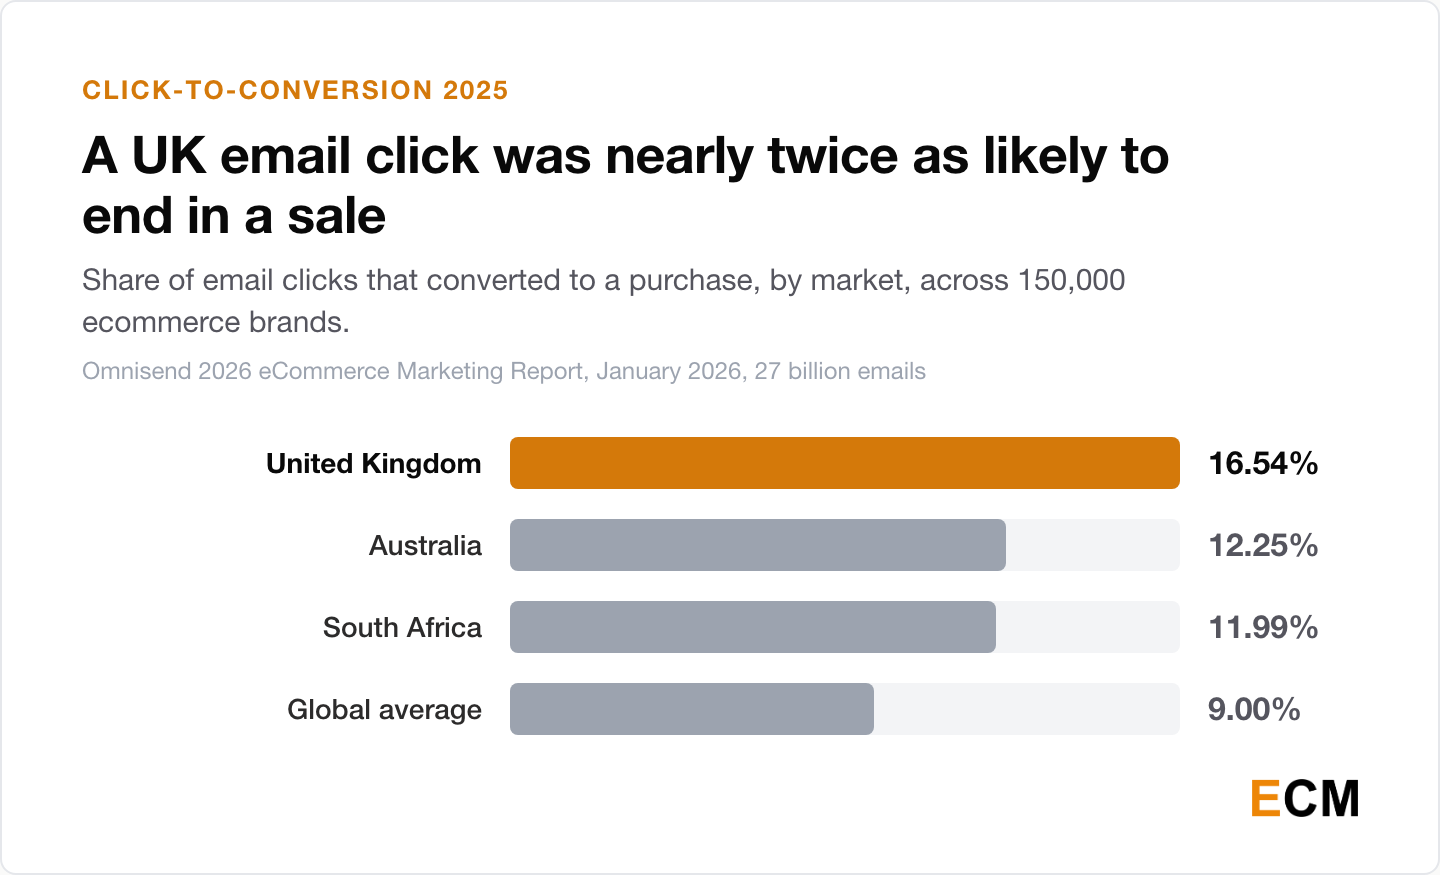
44. Email click-to-conversion rates ran highest in the United Kingdom at 16.54%, followed by Australia at 12.25% and South Africa at 11.99%, against a 9.0% global average (Omnisend 2026 eCommerce Marketing Report).
45. The highest-converting industries in 2025 were games at 15.1%, food and drink at 14.9%, and health at 14.8% (Omnisend 2026 eCommerce Marketing Report).
46. The top 5% of brands generated 57% of total ecommerce order growth in 2025, the top 10% accounted for nearly 69%, and the top 20% drove 81% (Omnisend 2026 eCommerce Marketing Report). Market-level growth of 98% masked a far more concentrated reality at the brand level.
Email Personalization and Segmentation Statistics
47. 53% of marketers incorporate basic personalization, such as including a name in email copy (HubSpot State of Generative AI Report, 2026). After a decade of personalization tooling, more than half of what the industry calls personalization is still a first-name token.
48. 80% of consumers are more likely to make a purchase when brands offer personalized experiences (Epsilon, January 2018, 1,000 US consumers aged 18-64). This page has cited the figure since 2023 and it remains the most-quoted personalization stat in marketing. It is also eight years old, and Epsilon has not refreshed it.
49. Segmented emails drive 30% more opens and 50% more click-throughs than unsegmented ones (HubSpot State of Marketing Report, 2023). No re-test has been published since, so this is a pre-2024 figure. Cite it with the year or not at all.
AI Email Marketing Statistics for 2026
Adoption numbers for artificial intelligence in email are high, self-reported, and mostly collected by companies selling AI features. Read them as intent rather than as measured output.
How Many Marketers Use AI in Email
50. 94% of marketers plan to use AI in their content creation processes, including blog articles, in 2026 (HubSpot 2026 State of Marketing Report, n=1,505). HubSpot qualifies this to blog content, so read it as a signal about content operations generally rather than an email-specific figure.
51. 70% of marketers predicted that up to half of their email operations would be AI-driven by 2026, and 18% expected AI to handle 50-75% of email marketing tasks (Litmus and Validity, State of Email 2025). That was the forecast a year out; nobody has published the measured outcome.
52. 49% of marketers said they planned to use generative AI for static copy creation, and AI-powered image generation adoption had risen 340% year over year (Litmus and Validity, State of Email 2025).
What AI Changed About Production Time
53. Only 6% of teams required more than two weeks to produce an email in 2025, compared to 62% in 2024 (Litmus and Validity, State of Email 2025). This is the largest single-year workflow shift in the dataset, and it is self-reported by an email-tool vendor’s own panel, so treat the direction as more reliable than the magnitude.
54. Over 80% of marketers report using AI for content creation, including email copy (HubSpot State of Generative AI Report, 2026).
55. 62.7% of marketers say the market now needs more unique, human-centered content to compete with the volume of AI-generated content (HubSpot 2026 State of Marketing Report, over 1,500 global marketers). The same survey panel reports near-universal intent to use AI and a shortage of content that does not read like AI. Both are true at once, and that tension is the story in AI email data this year.
What Email Platforms Shipped in 2025
56. Klaviyo launched Marketing Agent and Customer Agent in September 2025, both built on large language models and other generative AI technologies (Klaviyo Form 10-K, FY2025). Klaviyo does not disclose adoption percentages for either.
B2B, B2C, and Newsletter Email Statistics
Most benchmark data on this page skews ecommerce, because ecommerce platforms publish the most data. B2B figures are thinner and older, and each one below carries the year it was measured.
B2B Email Marketing Statistics
57. B2B companies send one email marketing campaign every 25 days on average (SuperOffice, based on 4,494 campaigns received across a 90-day monitoring window). SuperOffice last updated this research in October 2022, and it remains the most-cited primary B2B send-frequency study available.
58. 89% of B2B email campaigns were sent from a company name rather than a person’s name, in the same SuperOffice research last updated in 2022 (SuperOffice).
59. UK B2B email delivery rates dropped from 96.8% in 2022 to 92.1% in 2023, which the DMA attributed to job churn during “the great resignation” degrading list quality (DMA Email Benchmarking Report 2024).
60. Among Omnisend’s industry categories, business and industrial senders posted a 5.12% click-to-open rate and finance 4.89%, with internet leading at 6.98% (Omnisend Email Marketing Benchmarks, 27,000+ brands). These are industry verticals rather than a true B2B split, so read them as directional.
B2C and Mobile Email Statistics
61. 81% of people prefer to open emails on their smartphones, while 21% open on tablets (Campaign Monitor 2019 Email Trends Report, roughly 6 million campaigns and 1.8 billion opens).
62. 47% of people across demographics use a mobile application to check their email, while 26.9% still prefer desktop (Campaign Monitor 2019 Email Trends Report).
63. Ecommerce email open rates reached 30.7% in 2025 across 150,000 brands, the fifth consecutive annual rise (Omnisend 2026 eCommerce Marketing Report).
Email Usage and Demographics
Marketing benchmarks tell you what senders did. These tell you what recipients do, and they are the thinnest, oldest corner of the category.
64. 30% of US adults at least sometimes get news from email newsletters they subscribe to, and the share barely moves by age: 28% of 18-29s, 31% of 30-49s, 32% of 50-64s and 31% of over-65s (Pew Research Center, published February 2026, 5,153 US adults surveyed August 18-24, 2025).
Four points separate the highest age bracket from the lowest, which is close to no generational skew at all, and the opposite of what most channel-mix decks assume.
65. 66% of UK consumers check their main personal inbox at least daily, up from 63% two years earlier (DMA Consumer Email Tracker 2023, an online survey of 2,004 UK adults run in March 2023).
66. At the other end of the same question, 28% check that inbox every hour or more, down from 33% in 2021 (DMA Consumer Email Tracker 2023). Daily checking rose while hourly checking fell, which is a picture of people batching email rather than abandoning it. Both readings come from the tracker’s own tables, which now sit behind the DMA’s member gate.
67. 79% of consumers use a mobile device to receive email from brands, shops and websites, rising to 87% among 18 to 24 year olds, and standing at 83% for women against 75% for men (DMA Consumer Email Tracker 2023). This is a UK panel from 2023, so read it alongside the older Campaign Monitor device figures in stats 61 and 62 rather than instead of them.
68. One in 10 consumers ran a single primary email address for everything as of that 2023 survey, rising to 25% of those aged 65 and over, having abandoned their other accounts (DMA Consumer Email Tracker 2023).
Newsletter Platform Statistics
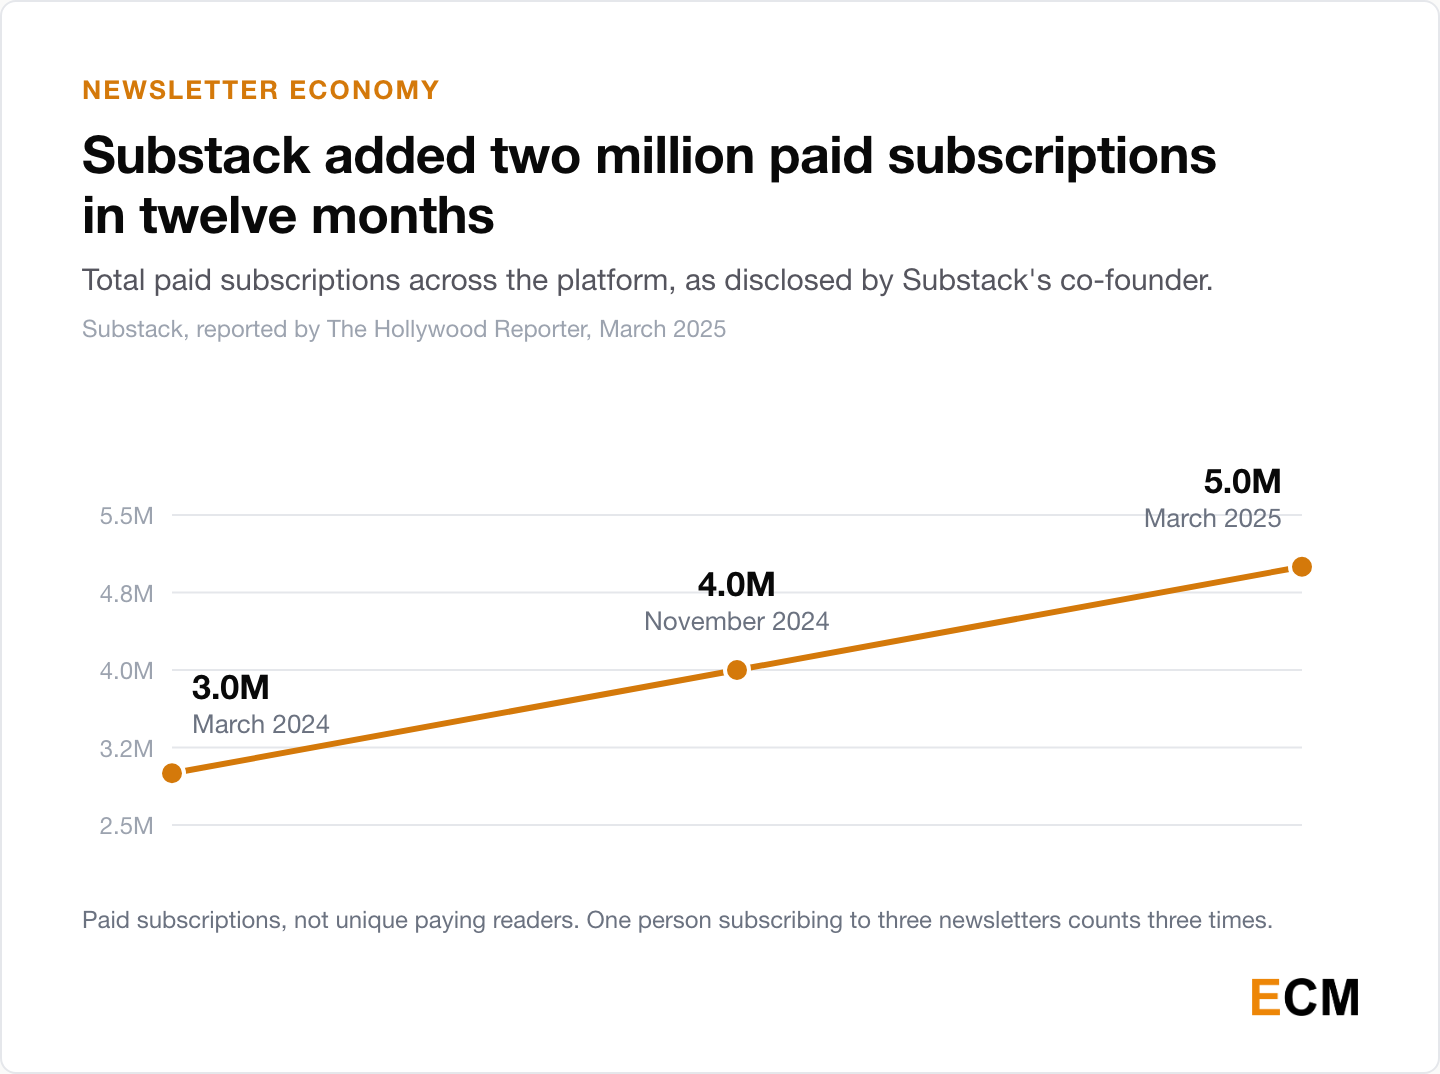
69. Substack passed 5 million paid subscriptions in March 2025, up from 4 million four months earlier and 3 million a year before (The Hollywood Reporter, March 2025, attributed to co-founder Hamish McKenzie). These count subscriptions, not unique paying readers.
70. 82% of Substack’s top 250 creators used audio and video as part of their regular content as of March 2025, up from half a year earlier (The Hollywood Reporter, March 2025).
71. Substack raised a $100 million Series C at a $1.1 billion valuation on July 17, 2025, led by BOND and The Chernin Group with Andreessen Horowitz participating (Axios, July 2025).
72. Paid subscriptions on beehiiv generated $19 million in 2025 against $8 million in 2024, a 138% jump (beehiiv State of Newsletters 2026).
73. The median time to a newsletter’s first dollar dropped to 66 days for newsletters launched in 2025 (beehiiv State of Newsletters 2026).
74. beehiiv reports newsletter open rates hitting 41% and above in 2025, and describes engagement as rising (beehiiv State of Newsletters 2026). That is a threshold rather than a platform mean, and beehiiv keeps its year-by-year tables behind a signup form, so it is not comparable to the three platform averages in stats 13, 15 and 63. Newsletter open rates also run high because of Apple MPP and image pre-fetching.
Email Deliverability Statistics and Requirements
Email deliverability requirements changed more between February 2024 and May 2025 than in the decade before them. All three major mailbox providers moved authentication from optional to mandatory. Microsoft then removed its announced junk-folder grace period and moved straight to rejection, six days before the deadline, which most roundups missed.
Gmail and Yahoo Sender Requirements
75. Senders of 5,000 or more messages per day to personal Gmail accounts must authenticate with SPF and DKIM, publish a DMARC policy, support one-click unsubscribe under RFC 8058, and keep spam rates reported in Postmaster Tools below 0.30% (Google Email sender guidelines, effective February 2024).
76. Yahoo enforced parallel authentication requirements from Q1 2024 but deliberately avoids a hard volume threshold, classifying bulk senders behaviorally instead (Yahoo Postmaster, October 2023).
77. 63% of senders surveyed were at least somewhat familiar with the new Gmail and Yahoo requirements, with awareness scaling by send volume (Mailgun State of Email Deliverability, first published June 2024; Mailgun has since folded the chapter into a rolling edition, so the live page carries later updates alongside the original survey).
78. More than 72% of survey respondents’ end consumers used Gmail (Mailgun State of Email Deliverability).
Microsoft Outlook Requirements
79. Senders of 5,000 or more emails per day to outlook.com, hotmail.com or live.com must implement SPF, DKIM and DMARC, effective May 5, 2025 (Microsoft Defender for Office 365, April 2025).
80. Microsoft hardened the penalty six days before it landed. The requirements as first announced said non-compliant mail “will first be routed to Junk” and might “eventually be rejected.” An April 29, 2025 update scrapped that grace period, returning “550; 5.7.515 Access denied, sending domain [SendingDomain] does not meet the required authentication level” from May 5, 2025 (Microsoft Defender for Office 365).
Plenty of 2026 roundups still describe junk-foldering as the penalty. It is rejection. Microsoft’s own post is partly to blame: the original junk-folder wording still stands further up the page, right alongside the update that replaced it.
What This Means for Senders
81. Taken together, these mean brands sending at any real volume now face authentication requirements at Gmail, Yahoo and Microsoft simultaneously. Gmail and Microsoft both draw the line at 5,000 or more messages a day to consumer mailboxes; Yahoo classifies bulk senders behaviorally instead.
If your deliverability slipped in 2025 and your SPF, DKIM and DMARC alignment has not been checked since, that alignment is the cheapest thing to rule out before you touch the creative.
82. For context on how aggressive the filtering has become, Gmail alone blocks nearly 15 billion unwanted messages daily (see stat 6), and the DMA’s B2B delivery data (stat 59) shows email list decay costing nearly five percentage points of delivery in a single year. Deliverability is now a maintenance discipline, not a setup step.
For the wider picture, I keep companion pages of content marketing statistics and SEO statistics.
Frequently Asked Questions
What Is the Average Email Open Rate in 2026?
There is no single number, and any roundup that gives you one is hiding the methodology. GetResponse reports 39.64% globally from 2023 send data, Mailchimp 35.63% across all industries from December 2023, and Omnisend 30.7% for ecommerce in 2025. The nine-point spread is definitional: the three cover different years and different populations, and Apple’s Mail Privacy Protection inflates all of them to different degrees. Use your own platform’s published methodology and compare against your own historical baseline instead of an industry average.
Is the “$42 ROI for Every $1 Spent” Stat Still Accurate?
It was accurate for one panel in one year. The figure is £42.24, measured in 2018 and published in the DMA’s 2019 Marketer Email Tracker, a survey of 197 UK marketers reporting in pounds.
It followed £32.28 in 2017, so the move was a 31% single-year jump. Litmus measured the same metric at 42:1 in 2019 and 36:1 in 2020.
For a deck, use “$36 per $1 spent, Litmus State of Email 2020, over 2,000 marketers” and keep the date attached.
Do Automated Emails Really Outperform Broadcast Campaigns?
Yes, and this is the most consistent finding on the page. Omnisend’s 2025 data shows automated emails at 2% of sends generating 30% of email revenue, worth $2.87 per send against $0.18 for scheduled campaigns. The prior year showed 37% of sales from 2% of volume. Abandoned cart and welcome flows alone drove 76% of automation orders. Both datasets skew ecommerce, so the exact ratios will not transfer to B2B services, but the direction is unambiguous.
Why Are Email Open Rates Unreliable Now?
Apple’s Mail Privacy Protection pre-fetches images on the user’s behalf, registering an open whether or not anyone read the message. Litmus reports MPP affecting roughly 55-60% of all opens, and Apple Mail accounts for 62.26% of tracked opens overall. GetResponse explicitly attributes part of its open-rate increase to MPP rather than to engagement. Click-through, click-to-conversion and revenue per send are the metrics worth managing to.
What Changed With Gmail, Yahoo and Microsoft Sender Requirements?
All three moved authentication from optional to mandatory for bulk senders between February 2024 and May 2025. Gmail and Microsoft both use a 5,000-per-day threshold for consumer mailboxes; Yahoo classifies bulk senders behaviorally instead.
All require SPF, DKIM and DMARC, with Gmail additionally requiring one-click unsubscribe and a spam rate below 0.30%.
Microsoft’s April 29, 2025 update removed the junk-folder grace period it had announced and moved straight to rejecting non-compliant mail with a “550; 5.7.515 Access denied” response from May 5, 2025.
How Many Email Users Are There Worldwide?
Radicati projects growth from over 4.4 billion users in 2024 to over 4.9 billion by 2028. It is the only worldwide-user estimate on this page, and its precision deserves scepticism: the model is proprietary rather than externally audited. The precise 2026 figure repeated across roundups comes from secondary blogs, not from Radicati.
What Is a Good Email ROI to Aim For?
Aim to measure your own before benchmarking anyone else’s. The published figures run from 32:1 to 45:1 across Litmus’ industry breakdown, with its all-industry average at 36:1 from the 2020 survey. All are self-reported by marketers to vendor surveys, none audited. Retail, ecommerce and consumer goods reported the highest at 45:1. Given that 22% of marketers said in 2025 that they struggle to prove email ROI at all, a defensible internal number beats a flattering external one.
Sources
Figures on this page come from the primary sources below.
- Klaviyo, Inc. Form 10-K FY2025, SEC, February 2026
- Omnisend 2026 eCommerce Marketing Report, January 2026, 27 billion emails across 150,000 brands
- Omnisend 2025 eCommerce Marketing Report, 2024 data
- Omnisend Email Marketing Benchmarks, 27,000+ brands
- Litmus Email Client Market Share, July 2026, over 1 billion opens
- Litmus State of Email Report, Fall 2020, over 2,000 marketing professionals
- Litmus 2021 State of Email
- Litmus 2024 State of Email Trends
- Litmus, The ROI of Email Marketing, industry breakdown
- Litmus and Validity, State of Email 2025, June 2025
- DMA Marketer Email Tracker 2019, 197 UK marketers surveyed January 2019
- DMA Email Benchmarking Report 2024
- DMA Consumer Email Tracker 2023, 2,004 UK adults surveyed March 2023
- GetResponse Email Marketing Benchmarks, 2023 send data
- Mailchimp Email Marketing Benchmarks, updated December 2023
- Campaign Monitor Email Marketing Benchmarks
- Campaign Monitor 2019 Email Trends Report, ~6 million campaigns
- beehiiv State of Newsletters 2026, January 2026
- HubSpot 2026 State of Marketing Report, over 1,500 global marketers
- HubSpot marketing statistics, State of Generative AI figures, 2026
- The Radicati Group, Email Statistics Report 2024-2028
- Google, Email sender guidelines, effective February 2024
- Google, Gmail security and spam protection, October 2023
- Yahoo Postmaster, sender requirements, October 2023
- Microsoft Defender for Office 365, high-volume sender requirements, April 2025
- Mailgun State of Email Deliverability, chapter first published June 2024
- SuperOffice B2B Email Marketing Report, 4,494 campaigns, updated October 2022
- Epsilon personalization research, January 2018, 1,000 US consumers
- Substack subscriber milestones via The Hollywood Reporter, March 2025
- Substack Series C via Axios, July 2025
- Statista, email marketing revenue worldwide, subscription page
- Pew Research Center, Email Newsletters as a Source of News, February 2026, 5,153 US adults
Written by
Editorial Staff
The Editorial Staff represents the writers, editors, and content creators who have worked (or work) at Elite Content Marketer. The experimenter-in-chief behind the team is Chintan Zalani, who has close to a decade of experience trying to make sense of the content marketing industry. Started in 2019, Elite Content Marketer is on a mission to help creators build sustainable businesses.
Related Articles
Marketing Data
60 B2B Buyer Statistics for 2026: 94% Use AI
60 B2B buyer statistics for 2026: 94% of buyers use LLMs, first contact comes 61% into the journey, and 13 people join the average decision.
Sep 12, 2026Read more →
Marketing Data
60 Zero-Click Search Statistics for 2026: 68% No Click
60 zero-click search statistics for 2026: 68.01% of US Google searches end with no click, AI Overviews cut position 1 CTR 58%, publishers lost 33%.
Sep 12, 2026Read more →
Marketing Data
62 Martech Statistics 2026: Stack Size to ROI
62 martech statistics for 2026: 15,505 tools tracked, budgets at 7.8% of revenue, 49% of tools in use, and where AI agents fall short.
Sep 12, 2026Read more →