Adult internet users spend 6 hours and 38 minutes a day online, the last global total DataReportal published (DataReportal, Digital 2025, 2025). The average screen time story in 2026 is not the total. It’s that phones took the growth and feeds took the phone.
Average Screen Time Statistics 2026: 6h 38m a Day, 60 Stats
 Written by Editorial Staff
Key Takeaways
- The global total has been flat for three years. 6h 38m a day in the latest count, against 6h 40m and 6h 37m in the two reports before it (DataReportal, 2025). Phones absorbed the growth instead: 3.6 hours a day in apps (Sensor Tower, 2026).
- US adults check their phones 186 times a day, and Boomers check more often than Gen Z. 224 pickups against 112, even though Gen Z logs nearly two more hours (Reviews.org, 2026).
- A lifetime on the phone now works out to nine or ten years. WhistleOut’s survey said 8.74 years in 2020; today’s daily figures and a 79-year life expectancy give about 9.2 to 10.4 years (CDC NCHS, 2026).
- Half of US teens report four or more hours a day outside schoolwork, and that half is more than twice as likely to report anxiety symptoms (CDC NCHS, 2024).
- Feeds are more than half of connected time. Social and video platforms take over 2.5 hours a day, 18 hours 36 minutes a week (DataReportal, Digital 2026, 2026).
- No health body sets an adult hour limit except Canada’s three recreational hours (CSEP, 2020). The “two hours for adults” line has no guideline behind it.
- Bans are the fastest-moving policy. 39 states and DC now require schools to restrict phones (Education Week, 2026), up from 11 states in April 2025 (KFF, 2025).
Average Screen Time per Day: Global and US Figures
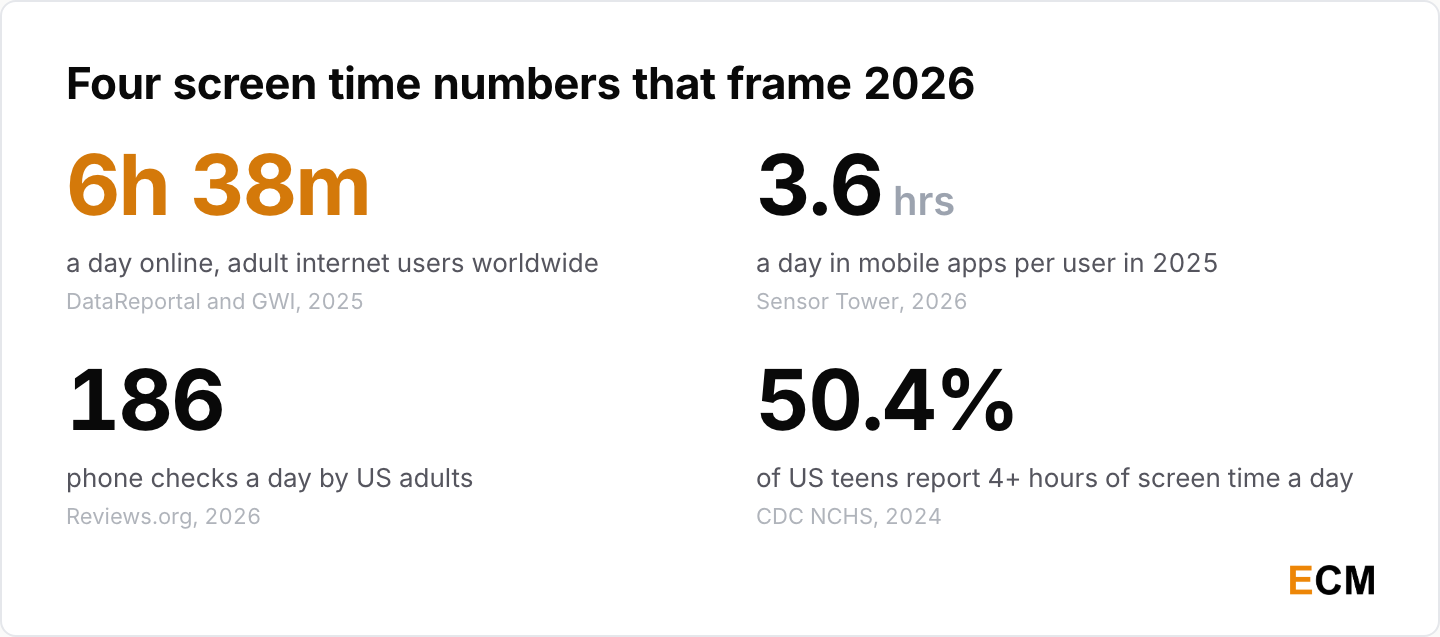
Four numbers frame everything below: the global daily total, time in apps, how often Americans pick up the phone, and how heavy teen use has become.
Global Daily Screen Time Across All Devices
The global figure has stopped climbing. Growth moved into apps, and DataReportal now measures weekly media time rather than a daily total.
- Adult internet users aged 16 to 64 spend 6 hours and 38 minutes a day online across all devices, the same as in late 2019 and below the 2017 and 2018 levels (DataReportal, Digital 2025, 2025).
- That is 2 minutes under the 6h 40m of the year before (DataReportal, Digital 2024, 2024) and roughly level with the 6h 37m before that, when the typical user had cut 20 minutes a day from a pandemic peak of almost 7 hours (DataReportal, Digital 2023, 2023; Digital 2022, 2022).
- Inside apps alone, people spent 5.3 trillion hours across iOS and Google Play in 2025, up 3.8%, or roughly 3.6 hours a day per mobile user (Sensor Tower, State of Mobile 2026, 2026).
Average Screen Time in the United States
American totals look enormous because every survey stacks devices that are used at the same time. Read them as exposure, not attention.
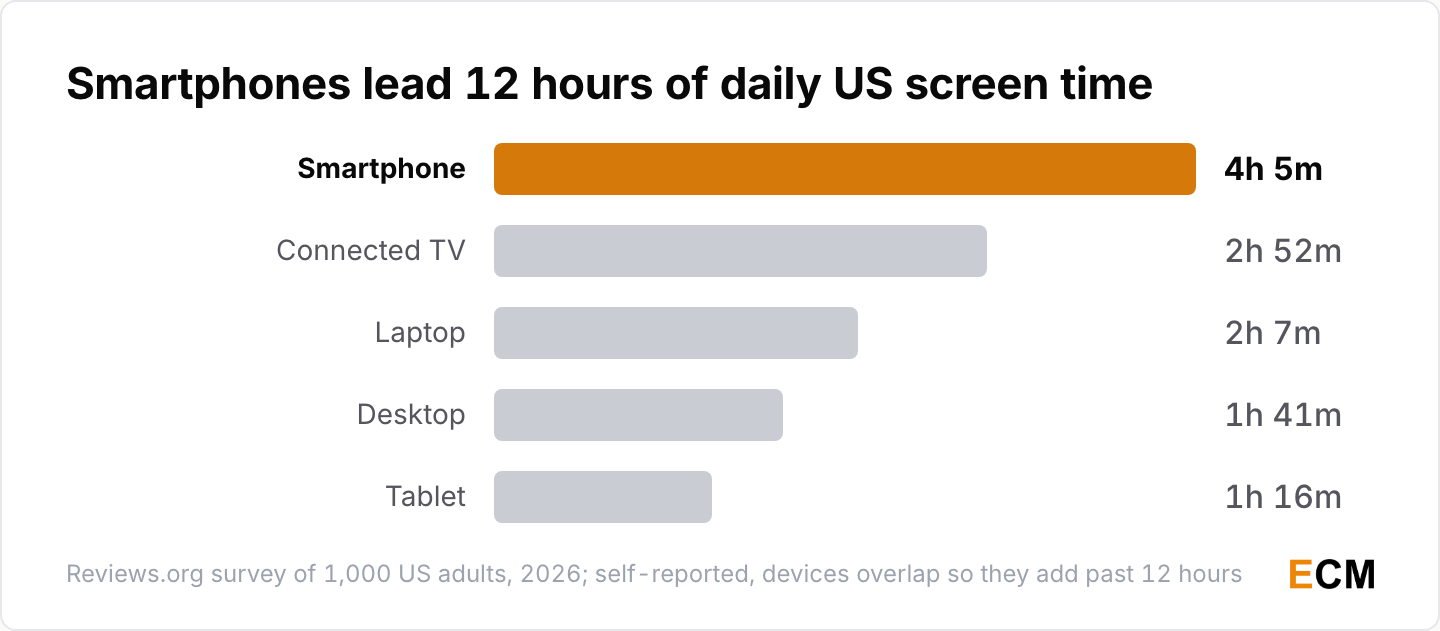
- Americans reported 12 hours 1 minute of daily screen time across devices in 2026, with smartphones the largest slice at 4 hours 5 minutes, then connected TV 2h 52m, laptop 2h 7m, desktop 1h 41m and tablet 1h 16m (Reviews.org, Screen Time and Internet Usage Statistics 2026, 2026; devices overlap).
- EMARKETER’s forecast lands in the same place: a record 13 hours 26 minutes a day with media in 2026, 44 minutes more than two years earlier, with an hour on the phone in front of the TV counted for both (EMARKETER, US Time Spent With Media H2 2026 Update, 2026); traditional TV falls to 2 hours 14 minutes in its final year as the leading activity (EMARKETER, 2026) and generative AI platforms enter the count at 16 minutes a day (EMARKETER, 2026).
- The government’s time diary is stricter: Americans aged 15 and over watched TV for 2.6 hours a day in 2025, half of all leisure time, and spent 37 minutes playing games or using a computer, up from 25 minutes in 2015 (Bureau of Labor Statistics, American Time Use Survey, 2026; primary activities only, so phone use inside other activities is not counted).
Mobile vs Computer Share of Screen Time
Mobile is the bigger slice everywhere, but computers still take almost three hours a day.
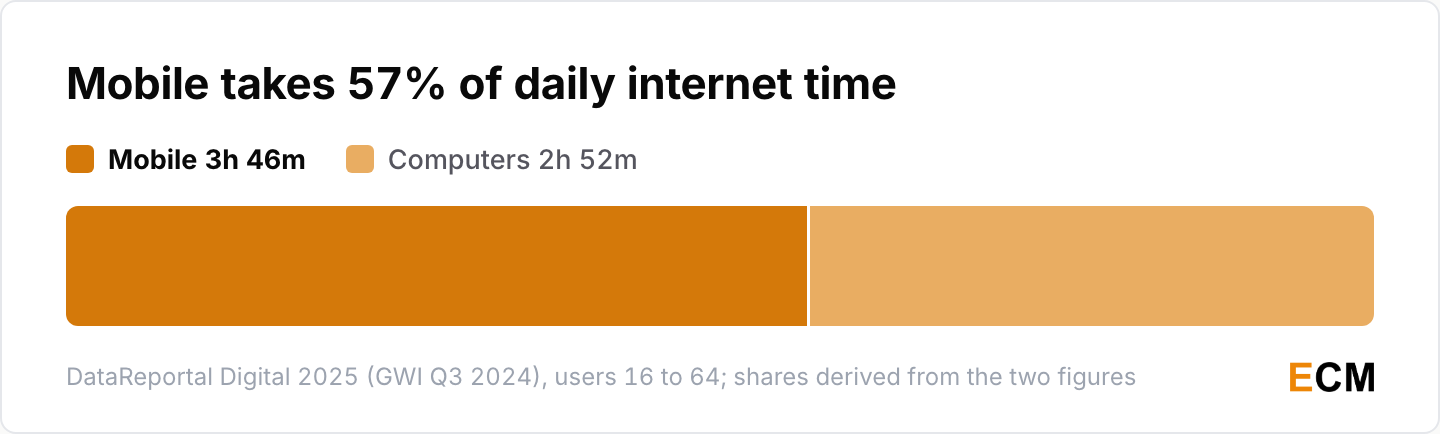
- Internet users spend 3 hours 46 minutes a day online on mobile devices against 2 hours 52 minutes on computers, so mobile is 56.8% of the total (DataReportal, Digital 2025, 2025; share calculated from the two figures).
- In Indonesia, Thailand, India and China, more than 60% of connected time happens on a mobile phone, while computers still take more than half in 18 of the 46 countries measured, including the US, Canada and most of Europe (DataReportal, Digital 2023, 2023).
Average Phone Screen Time: Daily, Yearly and Lifetime
How Much Time Does The Average Person Spend on Their Phone in a Lifetime?
Roughly a decade, whichever daily figure you start from. The survey number everyone quotes is below, with two fresh calculations beside it.
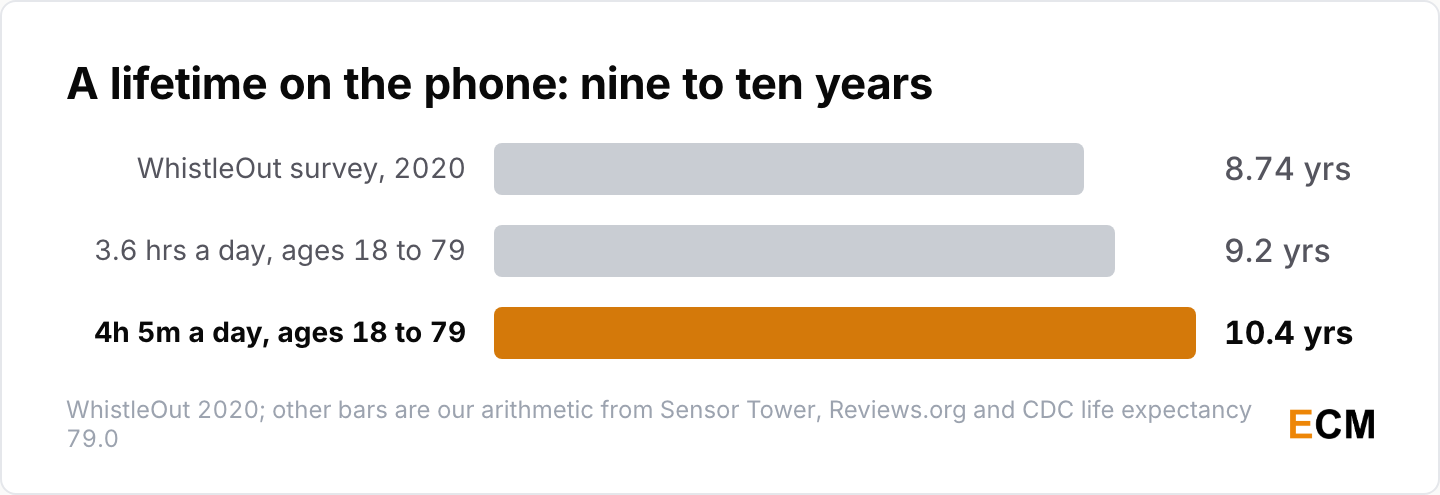
- The average person will spend 8.74 years of their life on a smartphone, about 76,500 hours, in a WhistleOut survey of roughly 1,000 people; millennials put 23.1% of their waking lives into the phone (WhistleOut, 2020).
- At 3.6 hours a day in apps (Sensor Tower, 2026), the 61 adult years inside a US life expectancy of 79.0 (CDC NCHS, Data Brief 548, 2026) add up to about 80,200 hours, or about 9.2 years (my arithmetic from the two figures: 3.6 x 365.25 x 61).
- At the 4 hours 5 minutes a day Americans self-report on smartphones (Reviews.org, 2026), the same span is about 91,000 hours, or 10.4 years, a quarter of waking adult life (my arithmetic from the same inputs).
Average Phone Screen Time per Day, Then and Now
eMarketer’s US series shows mobile time crossing four hours in the pandemic year and staying there. Newer surveys sit above it.
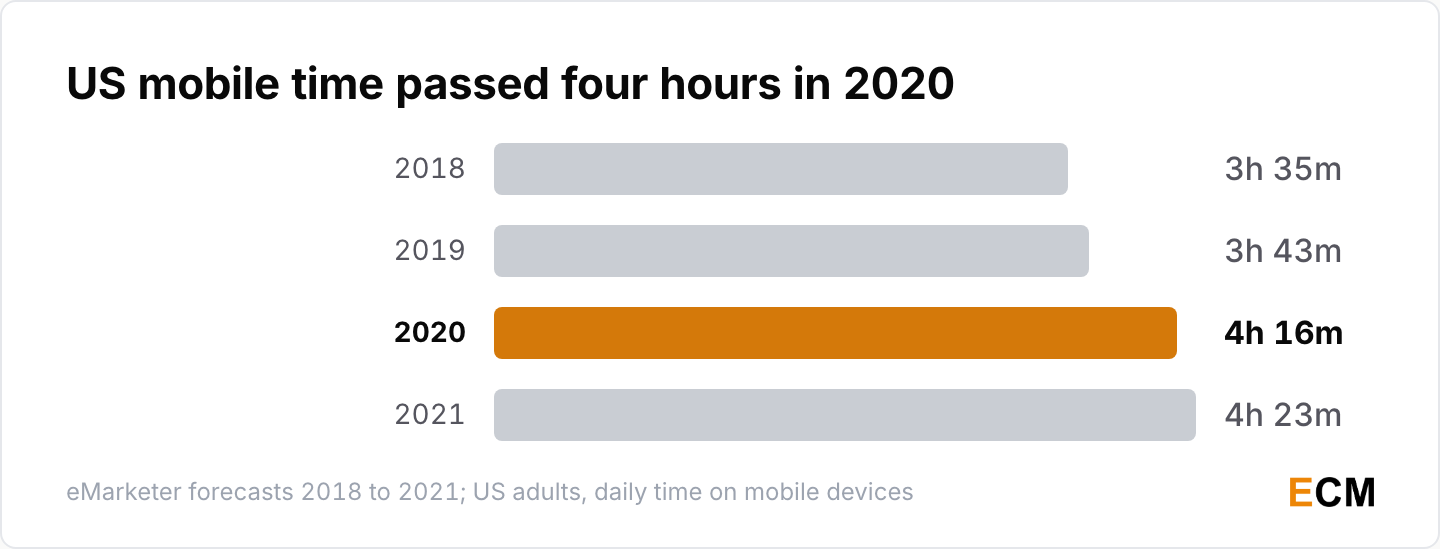
- In 2019 the average US adult spent 3 hours 43 minutes a day on mobile devices, the first year above TV’s 3 hours 35 minutes, with 2 hours 55 minutes of it on smartphones; in 2018 it was 3:35 against 3:44 for TV (eMarketer, 2019).
- Mobile time then jumped 31 minutes in 2020 to 4 hours 16 minutes, the fastest rise since 2014, and reached 4 hours 23 minutes in 2021 with 3 hours 10 minutes of it on smartphones (eMarketer, 2021).
- Self-reported US phone time ranges from 3 hours 14 minutes in Reviews.org’s 2025 survey (Reviews.org, 2026) through 4 hours 5 minutes in its 2026 survey (Reviews.org, 2026) to 5 hours 16 minutes in Harmony Healthcare IT’s December 2024 survey of 1,001 people, up 14% on the year (Harmony Healthcare IT, 2025).
How Often People Check Their Phones
Checks, not hours, are where the generations flip: Boomers pick up twice as often as Gen Z.
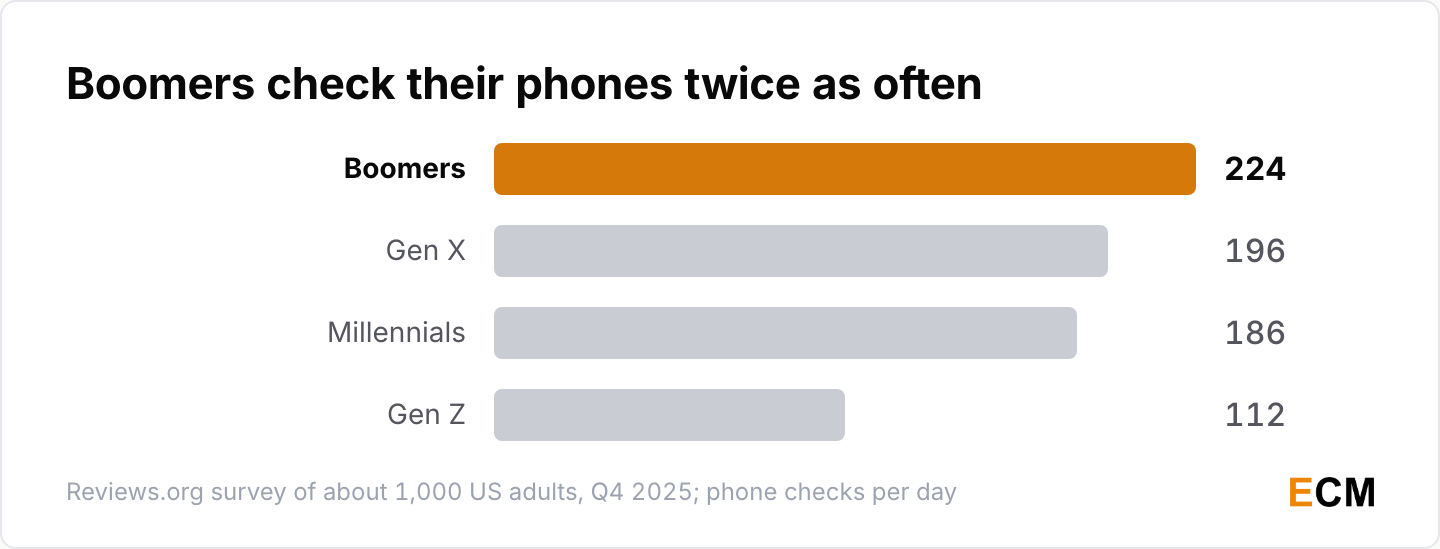
- Americans check their phones 186 times a day, 11.6 times an hour and down from 205 the year before; by generation it is Boomers 224, Gen X 196, Millennials 186 and Gen Z 112, and 84.6% check within 10 minutes of waking (Reviews.org, 2026).
- Teens aged 11 to 17 checked their phones over 100 times a day and used them for a median 43 minutes during school hours, with over half receiving 237 or more notifications a day, in a passive-tracking study of about 200 Android users (Common Sense Media, Constant Companion, 2023).
- Logged use runs far above what people guess: one 14-day study recorded 84.68 pickups and 5.05 hours a day, more than double participants’ own estimates, in a sample of 23 (Andrews et al., PLOS ONE, 2015), while a 653-adult logging study found a median of 1 hour 29 minutes of screen-on time a day (Christensen et al., PLOS ONE, 2016).
Average Screen Time by Age and Generation
Screen Time for Children 8 and Under
Children aged 8 and under average about two and a half hours a day, and it starts before age two.
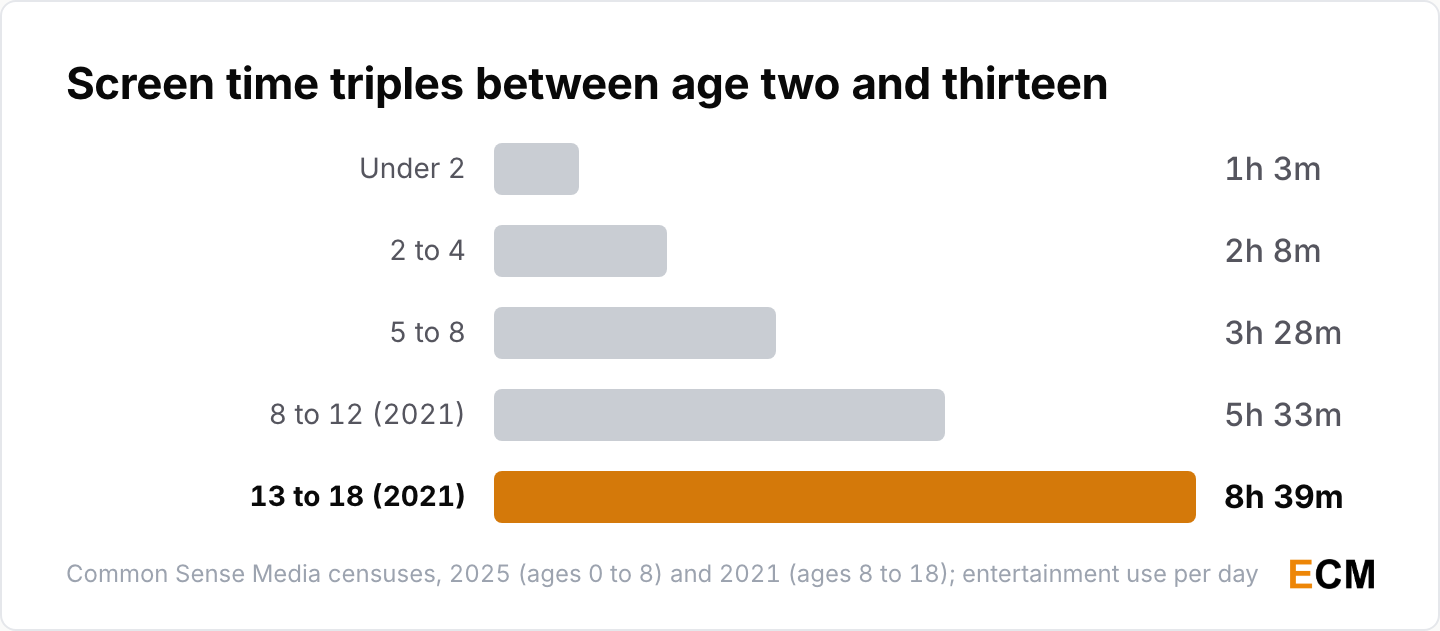
- Children aged 8 and under spent 2 hours 27 minutes a day with screen media in 2024, roughly the same as the 2:24 of 2020: 1 hour 3 minutes under age 2, 2 hours 8 minutes at 2 to 4 and 3 hours 28 minutes at 5 to 8 (Common Sense Media, 2025 Census, 2025; 1,578 parents).
- On a given day 27% of these children use no screens while one in five uses them four or more hours (Common Sense Media, 2025 Census, 2025); gaming time is up 65% since 2020, 40% own a tablet by age 2 and one in four owns a phone by age 8 (Common Sense Media, 2025).
- Income is the widest gap: 3 hours 48 minutes in households under $50,000 against 1 hour 52 minutes at $100,000 or more, and boys spend 2:38 to girls’ 2:07 (Common Sense Media, 2025).
- Nine in ten US parents of children 12 and under say their child watches TV, 85% YouTube, 68% a tablet and 61% a smartphone; the share of under-2s watching YouTube rose from 45% to 62% between 2020 and 2025 (Pew Research Center, 2025).
Average Screen Time for Teenagers
Teens are the heaviest users on every measure, and half report four or more hours a day outside schoolwork.
- Tweens aged 8 to 12 average 5 hours 33 minutes and teens 13 to 18 average 8 hours 39 minutes of entertainment screen use a day, up from 4:44 and 7:22 in 2019, a 17% rise in two years (Common Sense Media, 2021 Census, 2022).
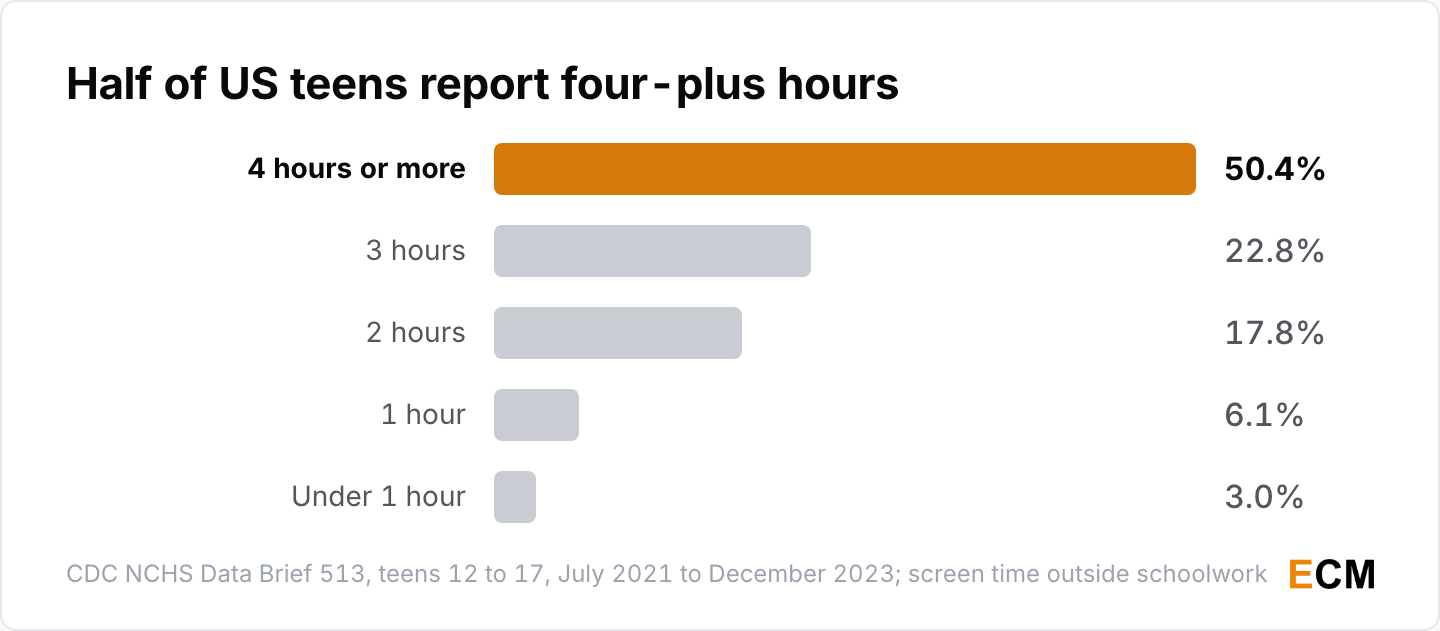
- 50.4% of US teens aged 12 to 17 report four or more hours of daily screen time, 22.8% three hours, 17.8% two hours, 6.1% one hour and 3.0% under an hour; the four-plus share is 55.0% at ages 15 to 17 against 45.6% at 12 to 14 (CDC NCHS, Data Brief 513, 2024).
- Teens on social apps specifically average 4.8 hours a day across seven platforms, 51% at four hours or more, rising from 4.1 hours at 13 to 5.8 at 17, with girls at 5.3 hours and boys at 4.4 (Gallup, 2023).
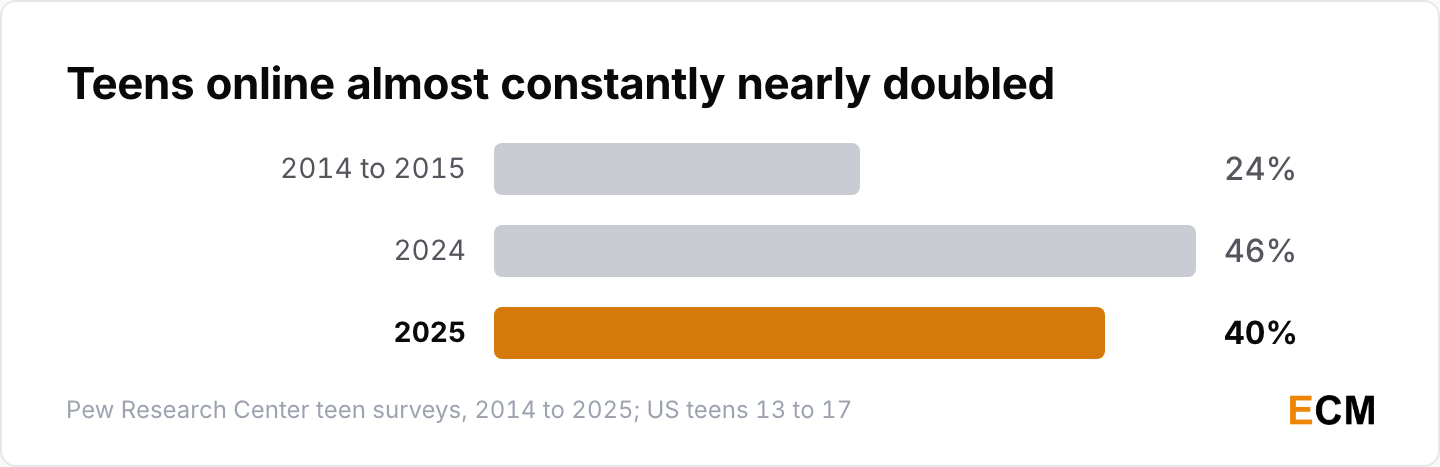
- Four in ten teens say they are online almost constantly and 97% use the internet daily; the almost-constant share was 24% a decade ago and 46% in 2024, and 36% now use at least one of the five big platforms almost constantly, with TikTok’s share up to 21% from 16% in 2022 (Pew Research Center, 2025; 2024 wave).
Gen Z, Millennials, Gen X and Boomers Compared
Gen Z’s phone time is nearly double the Boomers’, and young women lead the world on feeds.
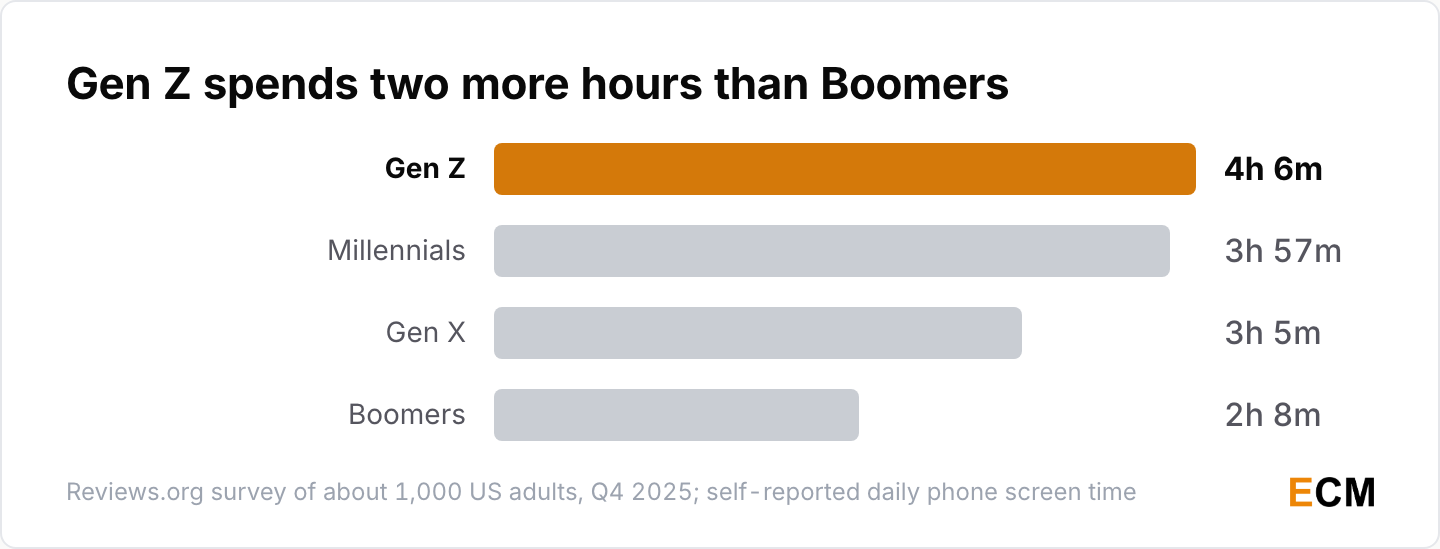
- Daily phone screen time in Reviews.org’s Q4 2025 survey runs Gen Z 4h 6m, Millennials 3h 57m, Gen X 3h 5m and Boomers 2h 8m (Reviews.org, 2026); Harmony Healthcare IT’s survey put Gen Z at 6 hours 27 minutes (Harmony Healthcare IT, 2025).
- Women aged 16 to 24 spend 25 hours 45 minutes a week on social and video feeds, more than 3 hours 40 minutes a day and roughly 22% of waking life, while men over 65 still spend more than an hour a day (DataReportal, Digital 2026, 2026).
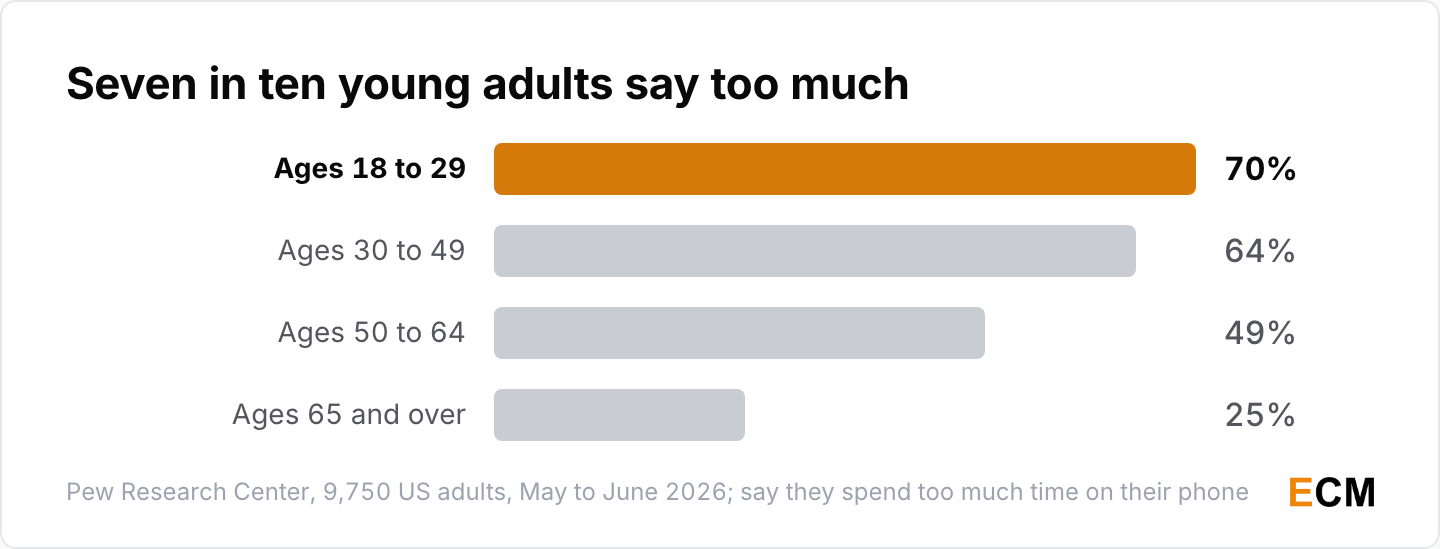
- Just over half of US adults say they spend too much time on their smartphone: 70% of 18 to 29 year olds, 64% of 30 to 49s, 49% of 50 to 64s and 25% of those 65 and over (Pew Research Center, 2026).
Screen Time Statistics by Country
Countries With the Highest Daily Screen Time
Emerging markets top the table and Japan sits at the bottom, more than an hour below anyone else.
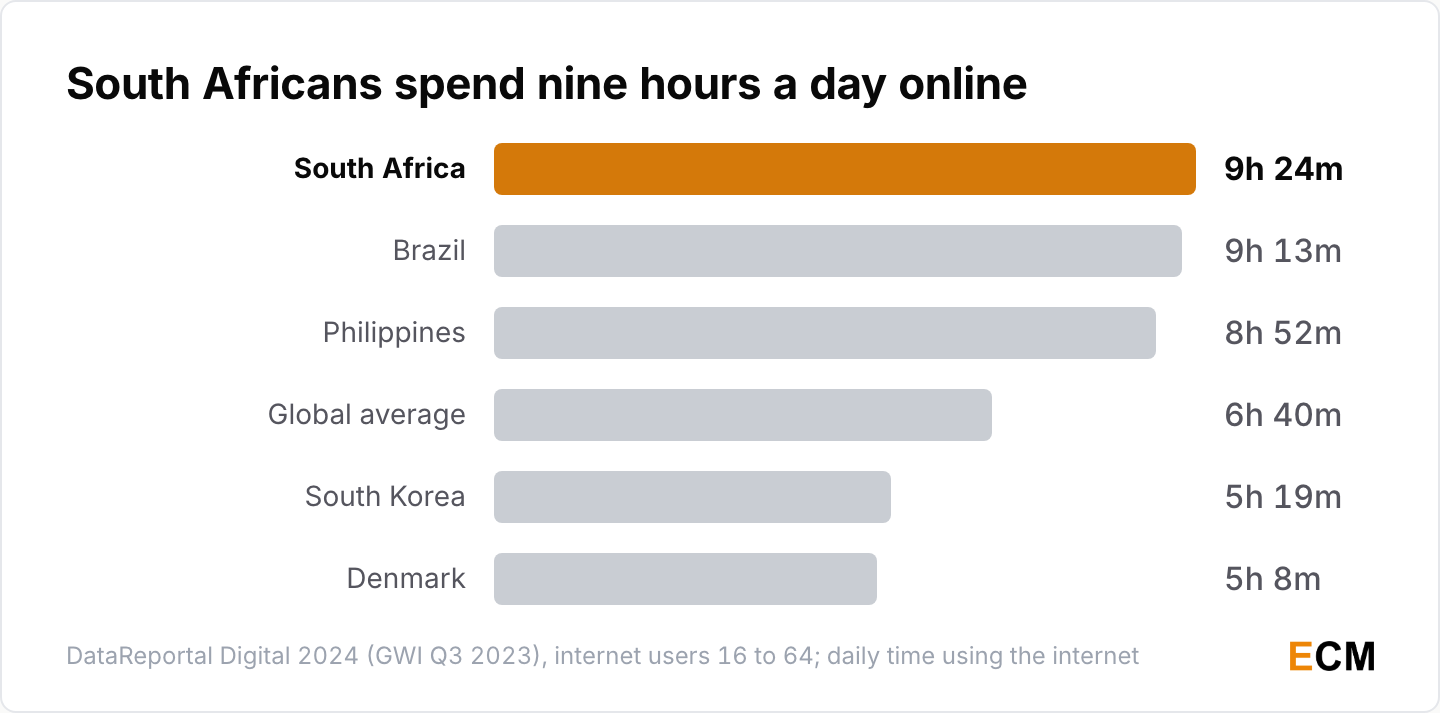
- South Africans spend 9 hours 24 minutes a day online, Brazilians 9 hours 13 minutes and Filipinos 8 hours 52 minutes, against a global average of 6 hours 40 minutes in the last report that ranked countries in its text (DataReportal, Digital 2024, 2024).
- Japanese users report less than 4 hours a day, over an hour less than any other nation surveyed, with Denmark at 5 hours 8 minutes and South Korea at 5 hours 19 minutes next lowest (DataReportal, Digital 2024, 2024).
Average Screen Time per Day in India
India is the biggest phone market by total hours, and its daily figure is climbing faster than the world’s.
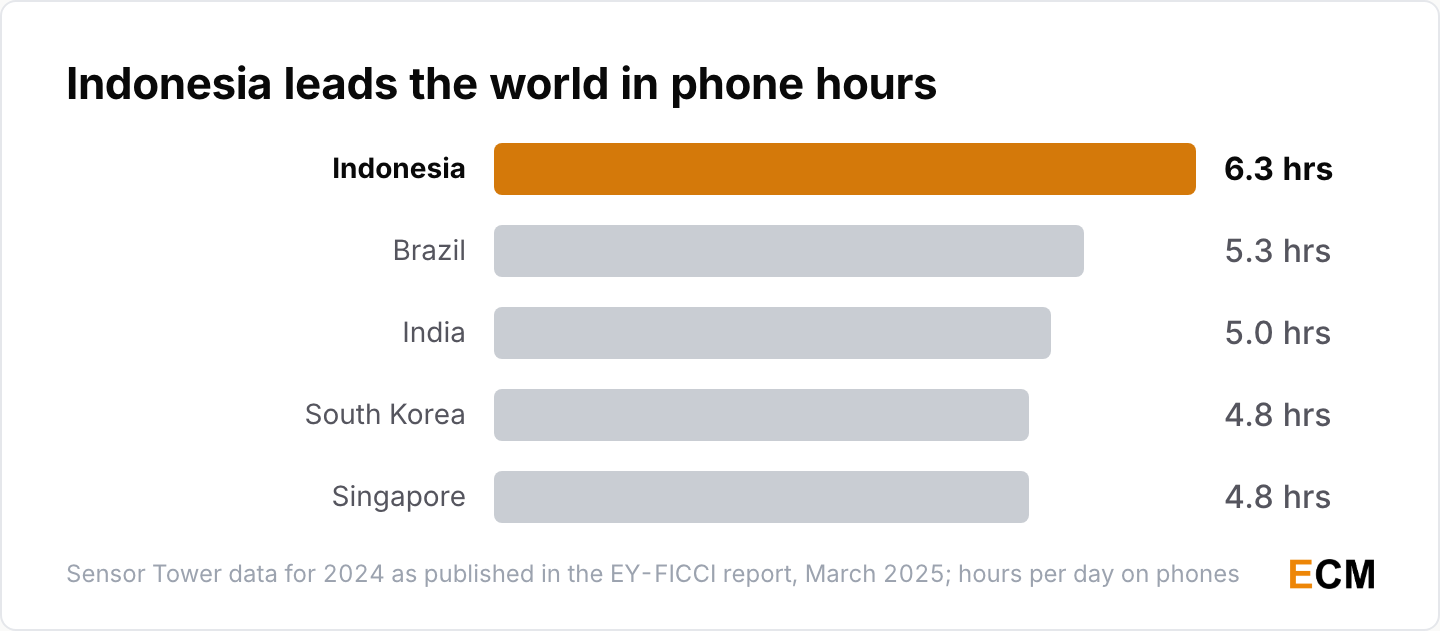
- Indians spent 4.95 hours a day on phone apps in 2024, up 3.1%, behind only Indonesia at 6.3 hours and Brazil at 5.3, and more than 1.1 trillion hours in aggregate, higher than any other market (EY-FICCI, Sensor Tower data, 2025).
- In 2025 that rose to 1.23 trillion hours, up 9% against 3.8% globally, or about 5.8 hours a day per active smartphone, with 59% on media and entertainment (FICCI-EY, 2026; per device, so not directly comparable with the 2024 per-user figure), and Sensor Tower expects annual in-app time to pass 1.3 trillion hours in 2026 (Sensor Tower, 2026).
Where Screen Time Goes: Social Media, Video and TV
Social Media and Video Feeds Take Half
Feeds eat more than half of connected time, and TikTok users log the most per day.
- The typical internet user spends 2 hours 21 minutes a day on social media, 10 minutes less than two years earlier (DataReportal, Digital 2025, 2025).
- Under GWI’s revised questions, online adults spend more than an hour a day on social networks and well over 2.5 hours once YouTube and TikTok are added, 18 hours 36 minutes a week and roughly 16% of waking hours (DataReportal, Digital 2026, 2026).
- Social apps absorbed nearly 2.5 trillion hours in 2025, up 5%, more than 90 minutes a day for the average mobile user and close to half of the 5.3 trillion app hours (Sensor Tower, State of Mobile 2026 report, 2026; share calculated from the two totals).
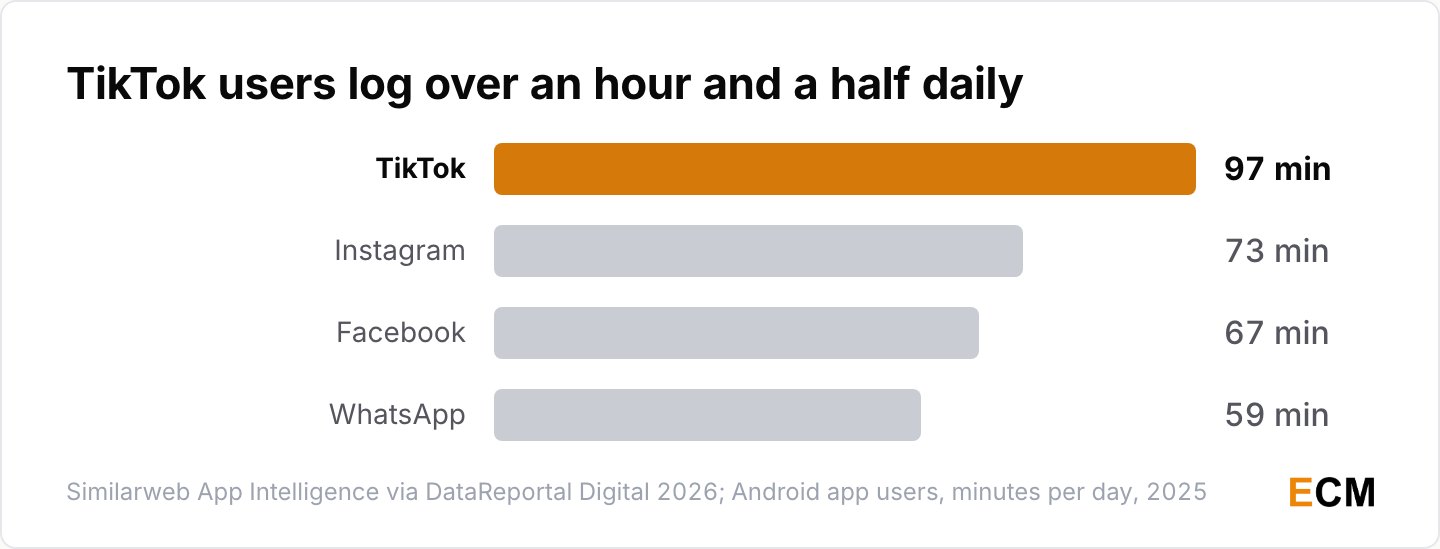
- The typical TikTok user spends 1 hour 37 minutes a day in the Android app, about 14% longer than the typical YouTube user, with Instagram at 1 hour 13 minutes, Facebook 67 minutes and WhatsApp 59 (Similarweb via DataReportal, 2026).
Streaming Now Beats Cable and Broadcast
Television is still three hours a day, but in the US streaming has taken half of it.
- Internet users watch 3 hours 13 minutes of television a day across all formats, with streaming at 1 hour 24 minutes just ahead of linear TV’s 1 hour 20 minutes, and listen to roughly 52 minutes of podcasts (DataReportal, Digital 2025, 2025); streaming is now 50.4% of TV watch time globally and 59.4% in the US (DataReportal, Digital 2026, 2026).
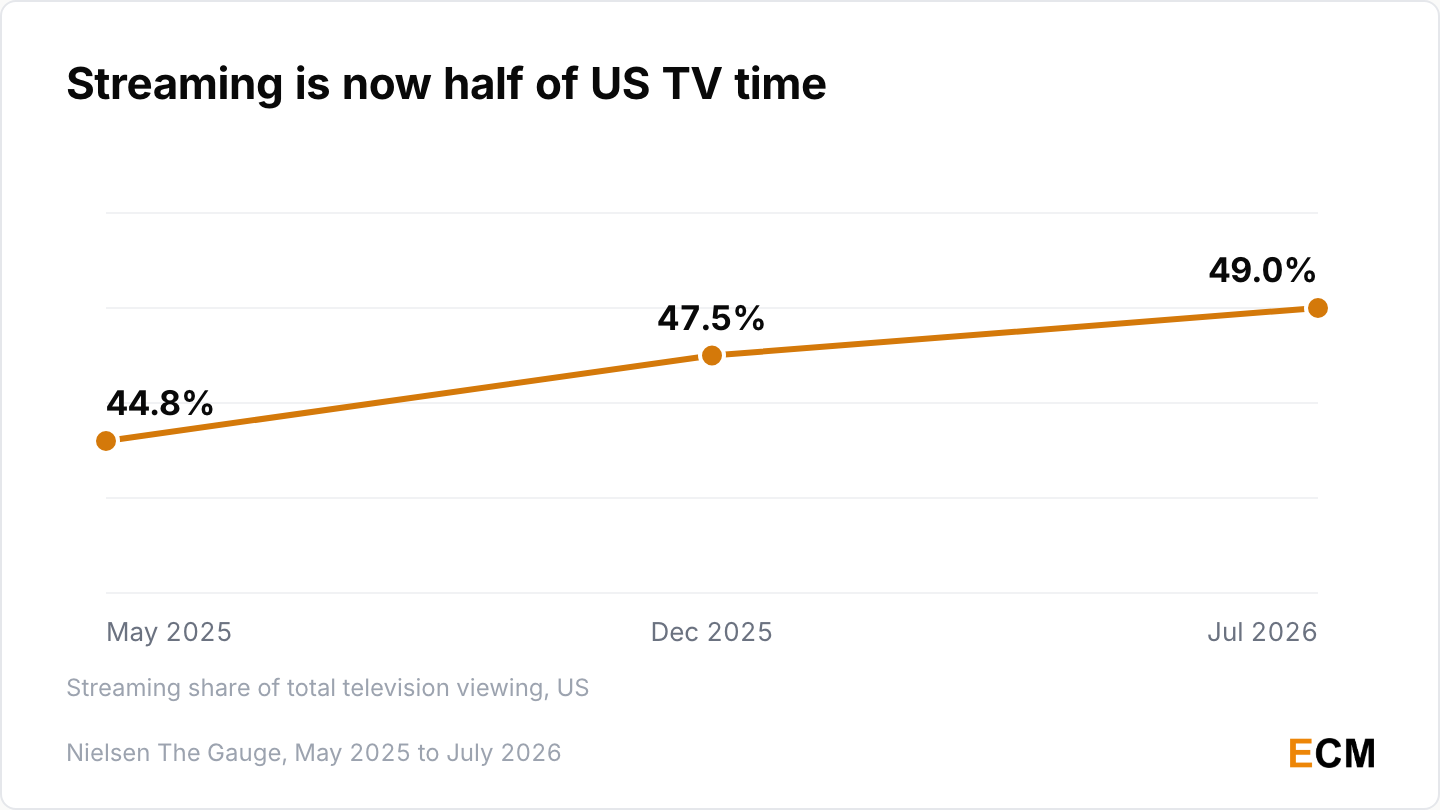
- Streaming took 44.8% of US TV viewing in May 2025, passing broadcast and cable combined for the first time (Nielsen, 2025), then 47.5% in December (Nielsen, 2026) and 49.0% in July 2026, when YouTube alone hit a record 14.2% against cable’s 18.7% and broadcast’s 19.5% (Nielsen, 2026).
The podcast minutes are the reason our podcast statistics page tracks listening and video together now.
What Screen Time Means for Content Marketers
The attention is on phones and feeds. The ad money has run ahead of it on social, and I read that gap as the case for earning reach rather than buying it.
- Search and social together take roughly 54% of global ad spend across all channels in 2025, social ads are 32.1% of digital spend at $277 billion, and more than 30% of adult internet users discover brands through social ads, the top channel for 16 to 34 year olds (DataReportal, Digital 2026, 2026; spend figures are Statista projections).
- Social networks take 12.5% of US adults’ media time but 27.7% of US ad spending in 2026 (EMARKETER, US Ad Spending vs. Time Spent 2026, 2026), and Facebook and Instagram alone claim over 20% of US digital ad revenue against about 7% of daily media time (EMARKETER, 2025).
YouTube is now the largest single share of US television, which is why our YouTube statistics and video marketing statistics pages treat it as a TV channel, and why the budget shifts show up in our digital marketing statistics.
How Much Screen Time Is Too Much? Rules and Health
Official Screen Time Guidelines by Age
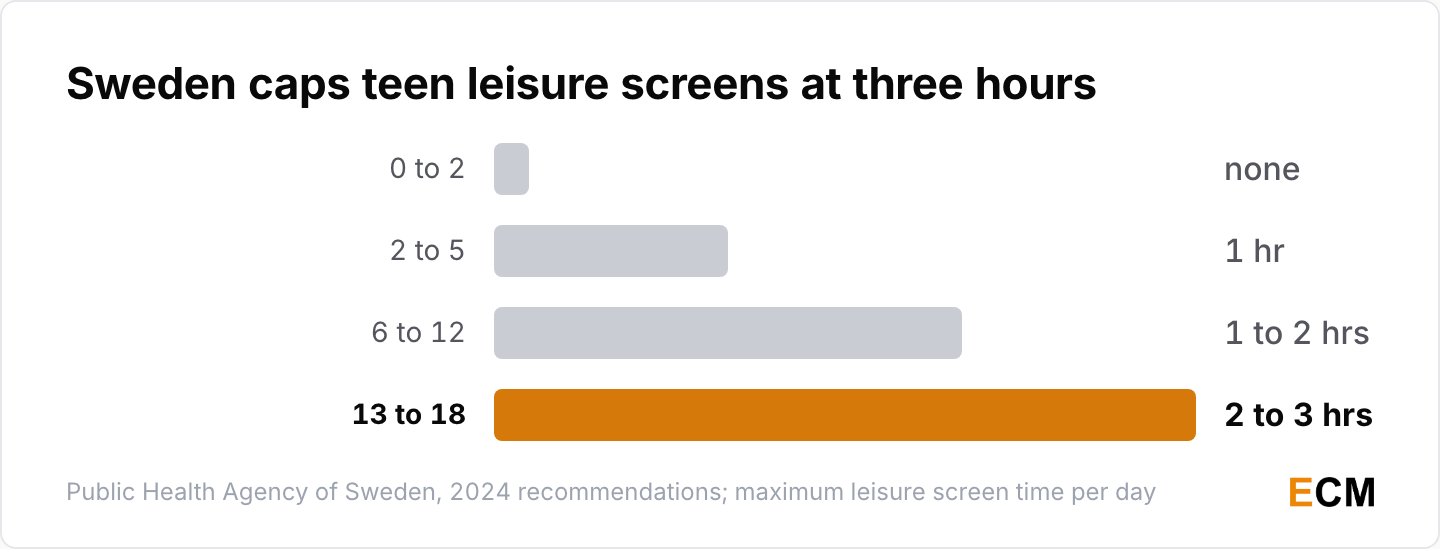
No body sets an adult limit except Canada. For children, the strictest current guidance is Sweden’s.
- The WHO recommends no sedentary screen time under age 2 and no more than 1 hour a day at ages 2 to 4, with less being better (World Health Organization, 2019); only 24.7% of under-2s and 35.6% of 2 to 5 year olds worldwide meet those limits (McArthur et al., JAMA Pediatrics, 2022).
- The AAP says to avoid TV and apps before 18 months except video chat and to cap entertainment screens at 1 hour a day from 18 months to age 5 (AAP, HealthyChildren.org, 2016); for older children it gives no set limit and describes the 2-hour rule as one “recommended in years past” (AAP, 2026).
- Sweden’s Public Health Agency recommends no screens at 0 to 2, at most 1 hour a day at 2 to 5, 1 to 2 hours at 6 to 12 and 2 to 3 hours at 13 to 18 (Folkhälsomyndigheten, 2024), and since June 2026 advises waiting until the year a child turns 13 before a smartphone (Folkhälsomyndigheten, 2026).
- Canada caps recreational screen time at 2 hours a day for ages 5 to 17 (CSEP, 2016) and at 3 hours for adults within 8 hours of sedentary time (CSEP, 2020).
- Australia’s social media minimum age of 16 applied to platforms from 10 December 2025, and more than 4.7 million under-16 accounts were deactivated, removed or restricted within days (Prime Minister of Australia, 2026).
What Is the 3-6-9-12 Rule for Screen Time?
It’s the set of age markers French psychiatrist Serge Tisseron launched in 2008, and France’s 2024 presidential commission still lists it among the best-known recommendations.
- The four markers: no screens before age 3, no personal digital device before 6, no internet even with an adult before 9, and no internet alone before the child has turned 12 (3-6-9-12+, Serge Tisseron, 2008).
- Tisseron issued an updated 3-6-13-18 set in 2020 (3-6-9-12+, 2020), and France’s 2024 commission went further: no screens before 3 and discouraged to 6, no phone before 11, no internet-connected phone before 13 and no social media before 15 (Commission Enfants et écrans, Élysée, 2024).
Is 7 Hours of Screen Time a Lot?
For a teenager, seven hours is above the median but not unusual. For an adult it is roughly the global average.
- 73.2% of US teens report three or more hours a day and only 9.1% an hour or less, so four hours is the teen median rather than an outlier (CDC NCHS, 2024; sums calculated from the published distribution), while adults worldwide average 6 hours 38 minutes online (DataReportal, 2025).
Screen Time and Mental Health, Sleep and Eyes
The strongest evidence is for anxiety, myopia and in-bed use. The sleep story is more nuanced than the headlines.
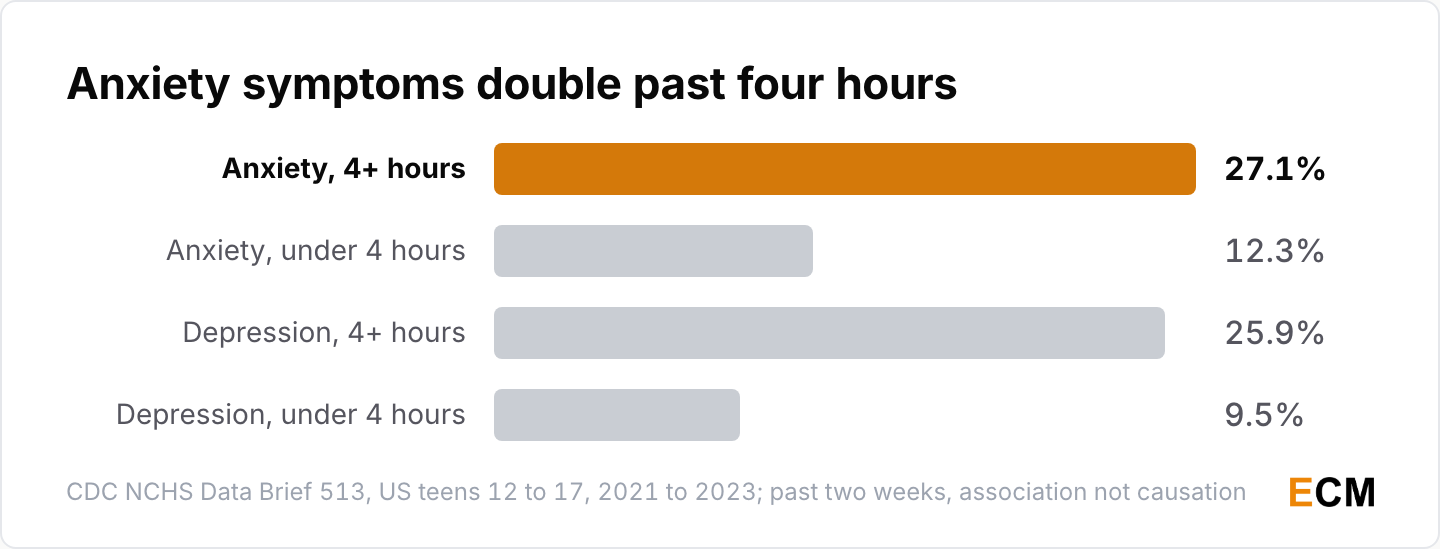
- Teens with four or more hours of daily screen time were more likely to report anxiety symptoms in the past two weeks (27.1% against 12.3%) and depression symptoms (25.9% against 9.5%), an association rather than proof of cause (CDC NCHS, Data Brief 513, 2024).
- Each additional hour of daily screen time is associated with 21% higher odds of myopia across 45 studies and 335,524 participants, with odds rising from 1.05 at one hour to 1.97 at four hours (Ha et al., JAMA Network Open, 2025).
- Interactive screen use once in bed cut sleep by 9 minutes per 10 minutes of use, and gaming by 17 minutes, in a camera-and-actigraphy study of 79 youths (Brosnan et al., JAMA Pediatrics, 2024), while a 2026 meta-analysis of 25 studies found daily screen use only slightly delays bedtime (r = 0.079) with no significant effect on sleep duration (JAMA Pediatrics, 2026). Even so, 87% of US adults sleep with the phone in the bedroom (American Academy of Sleep Medicine, 2023) and only 17% put devices away an hour before bed on six or more nights a week (National Sleep Foundation, 2025).
- Pooled prevalence of computer vision syndrome is 66% across 45 studies and 17,526 people (Scientific Reports, 2023); among 1,046 Indian university students surveyed in 2025, 94.1% reported at least one digital eye strain symptom and 73.7% met the clinical threshold (Frontiers in Public Health, 2026).
Reducing Screen Time: Bans, Limits and Detox Results
Phone Bans in Schools
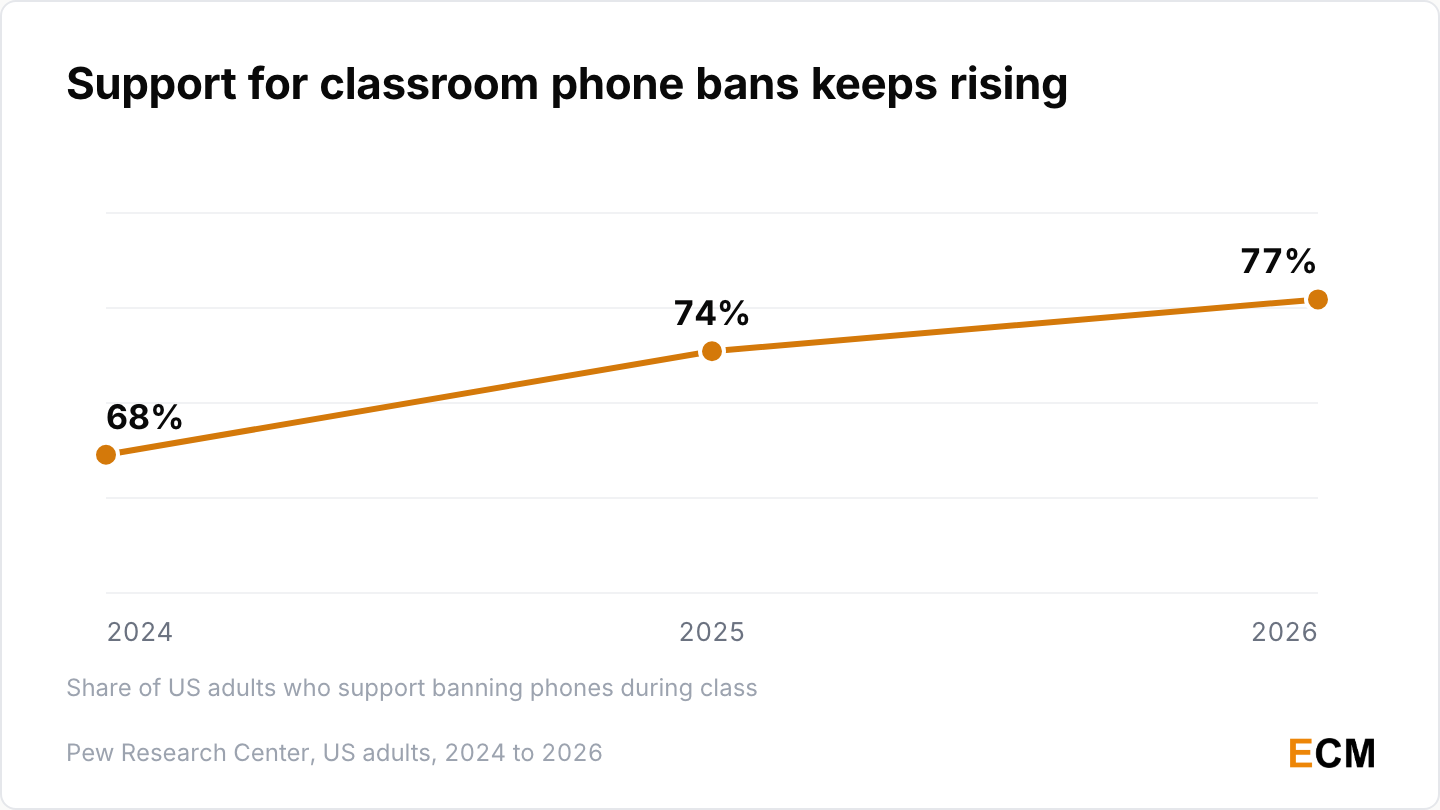
School phone bans went from a handful of states to most of the country in fifteen months, with adults far ahead of teens in supporting them.
- At least 39 states and the District of Columbia require districts to ban or restrict students’ phones (Education Week, 2026), up from 11 states with statewide policies on 30 April 2025 (KFF, 2025).
- 77% of US adults support in-class bans, up from 68% in 2024 and 74% in 2025, and 48% now back bell-to-bell bans against 43% opposed (Pew Research Center, 2026).
- Teens disagree: 41% support in-class bans, 17% support all-day bans and 73% oppose the all-day version (Pew Research Center, 2026).
How Adults Try to Cut Back
Half of adults have tried something in the past year. A quarter of them say it really worked.
- 45% of US adults tried to cut back on smartphone use in the past 12 months, 58% of those aged 18 to 49; among those who tried, a quarter say they were extremely or very successful and 52% somewhat (Pew Research Center, 2026).
- 50% of US adults actively limited their social media use in 2025 and two in five cut phone time overall; 32% say social media does more harm than good to their mental health against 24% who say the opposite (American Psychiatric Association, 2025).
- In 2020, 71% of parents of under-12s were at least somewhat concerned about too much screen time and 86% of parents of 5 to 11 year olds limited it (Pew Research Center, 2020); in 2025, 42% of parents say they could be doing better at managing their child’s screen time (Pew Research Center, 2025).
Does a Digital Detox Work?
Cutting the internet on the phone shows a real effect in a trial. Quitting social media alone does not, once you pool the studies.
- Blocking mobile internet on smartphones for two weeks improved sustained attention, mental health or wellbeing for 91% of those who completed it, in a trial that enrolled 467 people, and the effect on depression symptoms (dz = 0.56) was larger than the meta-analytic effect of antidepressants (Castelo et al., PNAS Nexus, 2025).
- A seven-day social media abstinence trial with 61 participants found significant gains in mental wellbeing and social connectedness (Brown and Kuss, IJERPH, 2020); a meta-analysis of 10 such experiments with 4,674 participants later found no significant effect on positive affect, negative affect or life satisfaction (g = 0.03) (Scientific Reports, 2025).
Frequently Asked Questions
What is a healthy amount of screen time per day for adults and children?
There is no adult limit from the WHO, AAP or CDC. Canada’s guideline caps recreational screens at 3 hours a day for adults (CSEP, 2020). For children, the WHO says none under 2 and at most 1 hour at 2 to 4 (WHO, 2019); Sweden adds 1 to 2 hours at 6 to 12 and 2 to 3 hours at 13 to 18 (Folkhälsomyndigheten, 2024).
What is the average screen time for Gen Z?
Gen Z adults in the US report 4 hours 6 minutes a day on their phones, the most of any generation in Reviews.org’s Q4 2025 survey (Reviews.org, 2026), and 6 hours 27 minutes in a second survey (Harmony Healthcare IT, 2025). Globally, women aged 16 to 24 spend more than 3 hours 40 minutes a day on social and video feeds alone (DataReportal, 2026).
What is the 3-6-9-12 rule for screen time?
Serge Tisseron’s 2008 markers: no screens before 3, no personal device before 6, no internet even accompanied before 9, no internet alone before 12 (3-6-9-12+, 2008). France’s 2024 commission now recommends no phone before 11 and no social media before 15 (Élysée, 2024).
Is 7 hours of screen time a lot?
For an adult it is close to the global average of 6 hours 38 minutes a day online (DataReportal, 2025). For a teen it sits below the 8 hours 39 minutes entertainment average (Common Sense Media, 2022) but inside the half of teens the CDC links to more than doubled anxiety symptoms (CDC NCHS, 2024).
What is the average screen time per day in the US and worldwide?
Worldwide, adult internet users spend 6 hours 38 minutes a day online (DataReportal, 2025). US adults report 12 hours 1 minute a day across devices, 4 hours 5 minutes of it on smartphones (Reviews.org, 2026), and EMARKETER’s forecast is a record 13 hours 26 minutes with media in 2026 when multitasking is counted for each medium (EMARKETER, 2026).
How does screen time vary by age group?
It climbs steadily through childhood: 1 hour 3 minutes under age 2, 2 hours 8 minutes at 2 to 4, 3 hours 28 minutes at 5 to 8 (Common Sense Media, 2025), then 5 hours 33 minutes for tweens and 8 hours 39 minutes for teens (Common Sense Media, 2022). Among adults, phone time falls from 4h 6m for Gen Z to 2h 8m for Boomers (Reviews.org, 2026).
What are the negative effects of too much screen time?
The best-documented are anxiety and depression symptoms in heavy-use teens, double to nearly triple the rate of lighter users (CDC NCHS, 2024), a 21% rise in myopia odds per extra daily hour in children (JAMA Network Open, 2025), shorter sleep from interactive use in bed (JAMA Pediatrics, 2024) and digital eye strain in about two-thirds of people studied (Scientific Reports, 2023).
What actually works to reduce screen time?
The strongest trial evidence is for removing mobile internet from the phone: 91% of participants improved on attention, mental health or wellbeing in two weeks (PNAS Nexus, 2025). Social media abstinence alone shows no significant pooled effect (Scientific Reports, 2025). Among adults who tried to cut back, a quarter call it very successful (Pew Research Center, 2026).
Written by
Editorial Staff
The Editorial Staff represents the writers, editors, and content creators who have worked (or work) at Elite Content Marketer. The experimenter-in-chief behind the team is Chintan Zalani, who has close to a decade of experience trying to make sense of the content marketing industry. Started in 2019, Elite Content Marketer is on a mission to help creators build sustainable businesses.
Related Articles
Marketing Data
Black Friday Statistics 2026: 57 Facts + $11.8B in Sales
57 Black Friday statistics: $11.8B in US online sales in 2025, 202.9M US weekend shoppers, and 84% of shoppers suspect inflated pre-sale prices.
Oct 22, 2026Read more →

Marketing Data
58 AI Personalization Statistics for 2026: ROI + Adoption
58 AI personalization statistics for 2026: 78% of marketers can’t make enough personalized content, and 87% of brands rate it good while 29% of consumers agree.
Oct 2, 2026Read more →
Marketing Data
60 AI Workflow Automation Statistics for 2026
60 AI workflow automation statistics for 2026: 37% of respondents see any EBIT impact from AI, 6% are high performers, and agents scale at big firms.
Oct 1, 2026Read more →