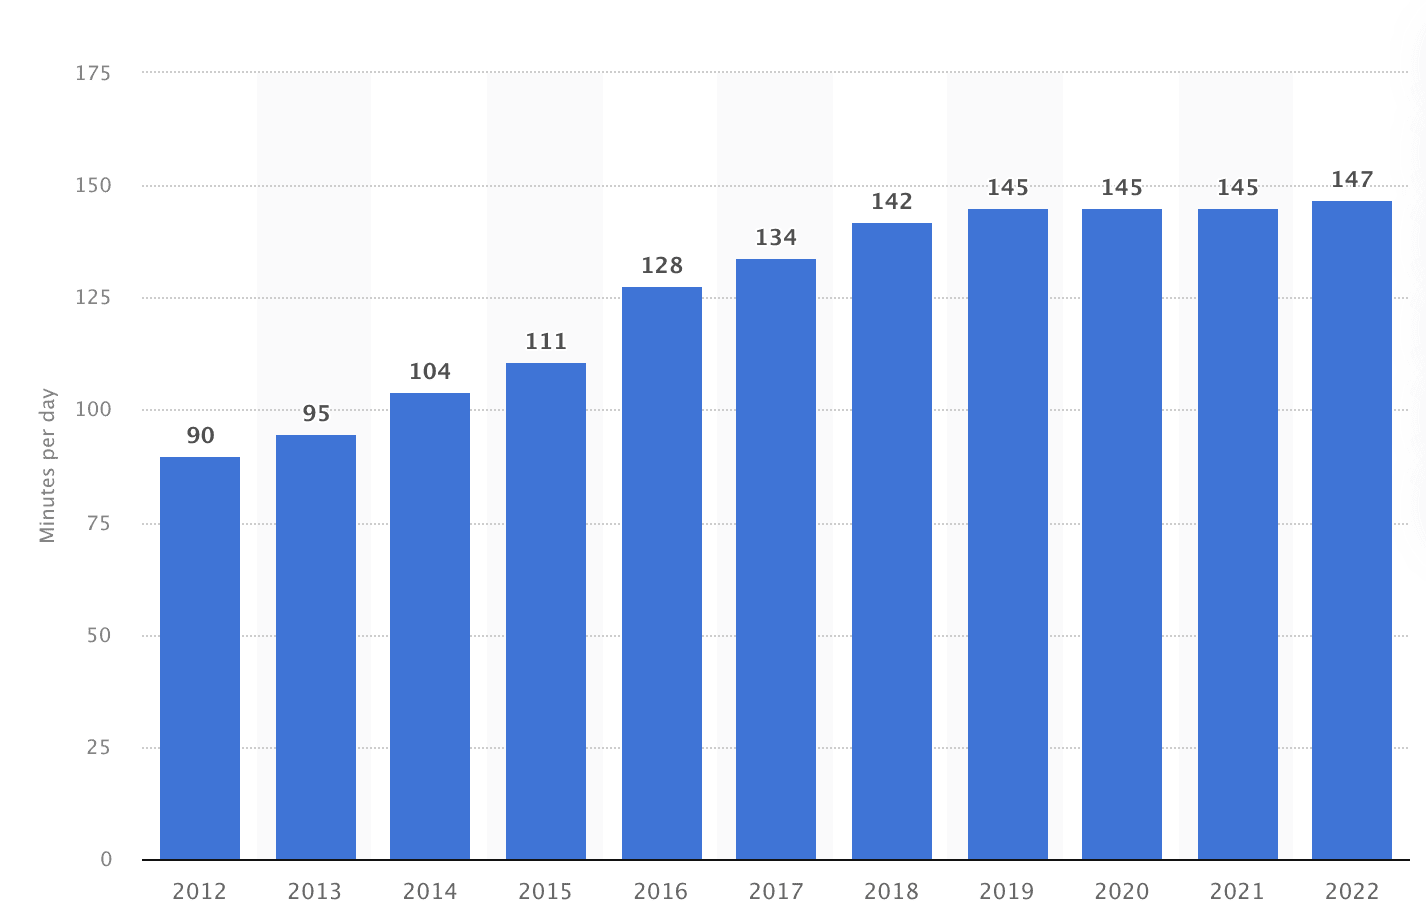
As of 2022, the time spent by average internet users worldwide on social media platforms came out to 147 minutes a day.
This is an increase of a couple of minutes from last year — when the average stood at 145 minutes. Specifically, in the United States of America, a social media user spends an average of only two hours and three minutes.
The above are research findings by Statista based on a survey from 2012 to 2022 for the age group between 16 to 64 years. The hours on social media seem to be rising over the last decade, though the increase isn’t steep in the last 2-3 years:

Today, let’s look at various stats showing the time spent on average on social media in 2022.
Time Spent on Social Media Overview
Social media can be a valuable addition to your life if used properly. It’s incredible in helping businesses to reach their target audience. However, the algorithms of these platforms are “weaponized” to keep a user scrolling infinitely.
Given this context, you won’t find the number of hours spent on social media apps surprising.
1. Since 2020, there has been a 12% rise in people saying they use social media less than they used to.
Source: Global Web Index (GWI)
2. As of January 2022, there are 4.62 billion active social media users worldwide.
(Source: Hootsuite)
How Much Time do Americans Spend on Social Media?
In the U.S., a person spends about 2 hours daily on social media, as per GWI. But according to Statista’s survey — as we saw in the introduction — the number stands at 2 hours and 3 minutes.
Average Daily Time Spent on Social Media Worldwide
People worldwide spend around 2:26 (hours: minutes) per day on social media.
(Source: GWI)
Average Time Spent on Different Social Media Platforms
These days, people like to spend most of their time on social media for entertainment purposes rather than for anything productive.
1. In 2021, people spent approximately 18.6 hours monthly on WhatsApp.
(Source: Statista)
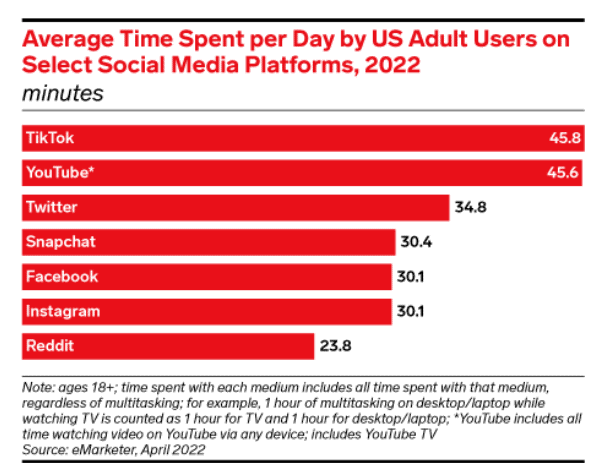
2. As of 2021, time spent on Facebook for the average American came out to be 33 minutes, which would include time spent on Facebook Messenger as well.
(Source: Statista)
3. A person spends about 19 minutes of the day on YouTube.
(Source: Alexa)

4. On average, a person in the U.S. spends around 30 minutes daily on Instagram.
(Source: eMarketer, April 2022)
5. People in the U.S. spend 35 minutes on Twitter, every day.
(Source: eMarketer, Insider Intelligence)
6. Daily active users spend approximately 30 minutes of their day on Snapchat.
(Source: Snapchat)
7. Being an old social media platform specially designed for professional communication, LinkedIn is operated for less than a minute per day.
(Source: BroadbandSearch)
8. Pinterest is utilized for approximately 14 minutes per day.
(Source: BroadbandSearch)

Social Media Platform Statistics
To understand the social media dynamics of various apps, I have split up and mentioned the key statistics of each app separately.
1. Snapchat has 383M active daily users on average.
(Source: Snapchat)
2. Twitter has 238 million monetizable daily active users.
(Source: Statista)
3. As of the first quarter of 2022, Pinterest had 433 million MAU (monthly active users) worldwide.
(Source: Statista)
4. In 2021, Instagram surpassed 2 billion active monthly users.
(Source: Statista)
Launched in 2010, the platform gained 1 billion MAU (monthly active users) for the first time in 2018. So it took eight years to gain 1 billion MAU and, surprisingly, only two years to double it.
5. As of January 2022, WhatsApp is considered the most used mobile messenger app globally, with 2 billion monthly active users.
(Source: Statista)
6. In January 2022, Facebook had the highest number of monthly active users at 2.89 billion out of all social networks.
(Source: Statista)
7. As of 2021, LinkedIn had more than 830 million people registered on its professional networking site.
(Source: LinkedIn)
8. As of April 2022, India has the highest number of YouTube users at 467 million.
(Source: Statista)
9. After Google.com, YouTube.com is the second most visited website worldwide.
(Source: Datareportal)
10.1 out of 4 internet users aged between 16 to 64 use social media platforms for work-related activities.
(Source: GWI)
Which is the Most Used Social Media App: Daily Active Users Statistics
With 2.891 billion monthly active users and 1.932 billion daily active users, Facebook is the most used social media app worldwide.
(Source: Statista1 , Statista2)
Social Media Usage: Mobile Devices vs. Desktops
As of April 2023, there were 4.8 billion active mobile social media users worldwide.
(Source: Statista)
Which Country has the Highest Number of Social Media Users?
According to Statista, China is the biggest social media market worldwide, ahead of second-ranked India with close to 639 million current social media users.
(Source: Statista)
Social Media Statistics by Demography
Further, let us have a look at the group which makes the most use of the internet for social media.
Gen Z
1. According to a study of Gen Z iOS users by Statista in the U.S., video social apps amassed the highest number of weekly average hours spent per user.
(Source: Statista)
2. In 2021, TikTok was the leading video social media app in the U.S. where a Gen Z iOS user spent more than 10 hours on weekly engagements.
(Source: Statista)
Gen Y
1. 44% of Gen Y or “millennials” in the U.S. like to use social media daily.
(Source: Statista)
2. 28% of millennials feel that they spend too much time on social media.
(Source: GWI)
3. 94% of millennials prefer watching short videos created by brands on social media platforms with a duration of fewer than 4 minutes.
(Source: GWI)
Gen X
1. 39% of Generation X prefer using social media apps every day.
(Source: Statista)
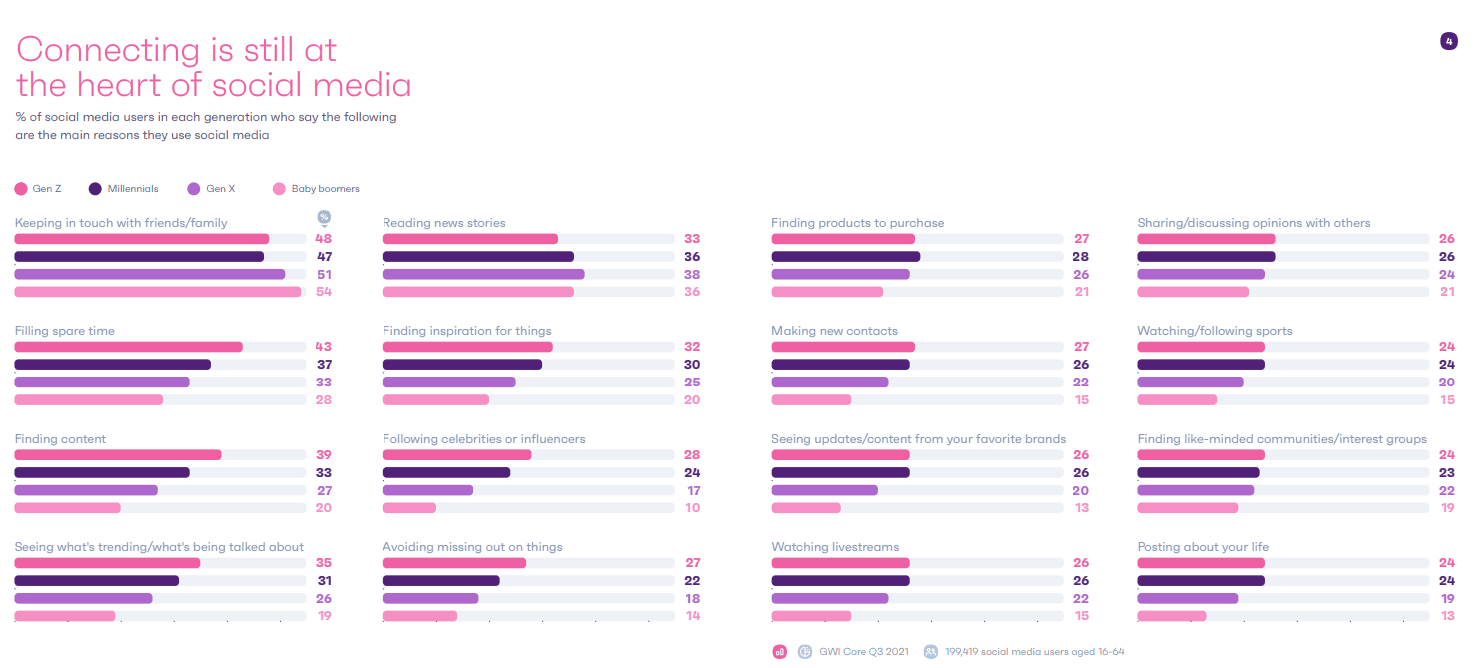
2. The chart curated by GWI represents reasons for various generations to use social media apps.
The data chart below signifies the reasons why most people prefer connecting with others using social media.
However, there is a small difference in the importance of reasons for the mentioned generations.
Gen Z makes complete use of social media apps, whereas millennials, Gen X, and Boomers do not give such platforms their due. Other generations still prefer using traditional methods of connecting with people.
(Source: GWI)

3. 51% of Gen X users use social media to stay in touch with their family.
(Source: GWI)
4. 23% of Gen Xers feel that they use social media less than they used to before.
(Source: GWI)
5. Only 11% of U.S. Gen Xers like to use Snapchat.
(Source: Statista)
So How Much Time Do People Spend on Social Media?
A lot.
Around the world, an average person spends at least a couple of hours on social media. This increases their average screen time and can leave a person feeling unfulfilled and unhappy, if not used the right way.
So in case you are doing that, please take back control of your day. Start measuring your time spent on Instagram (by using a tool like RescueTime). Find your average amount of time spent on social networks. And build better screen habits.
