When a Google search shows an AI Overview, users click a traditional result 8% of the time, against 15% with no AI summary (Pew Research Center, July 2025). The Google SEO statistics below all measure that trade.
57 SEO Statistics for 2026: AI Overviews, CTR, Rankings
 Written by Editorial Staff
Key Takeaways
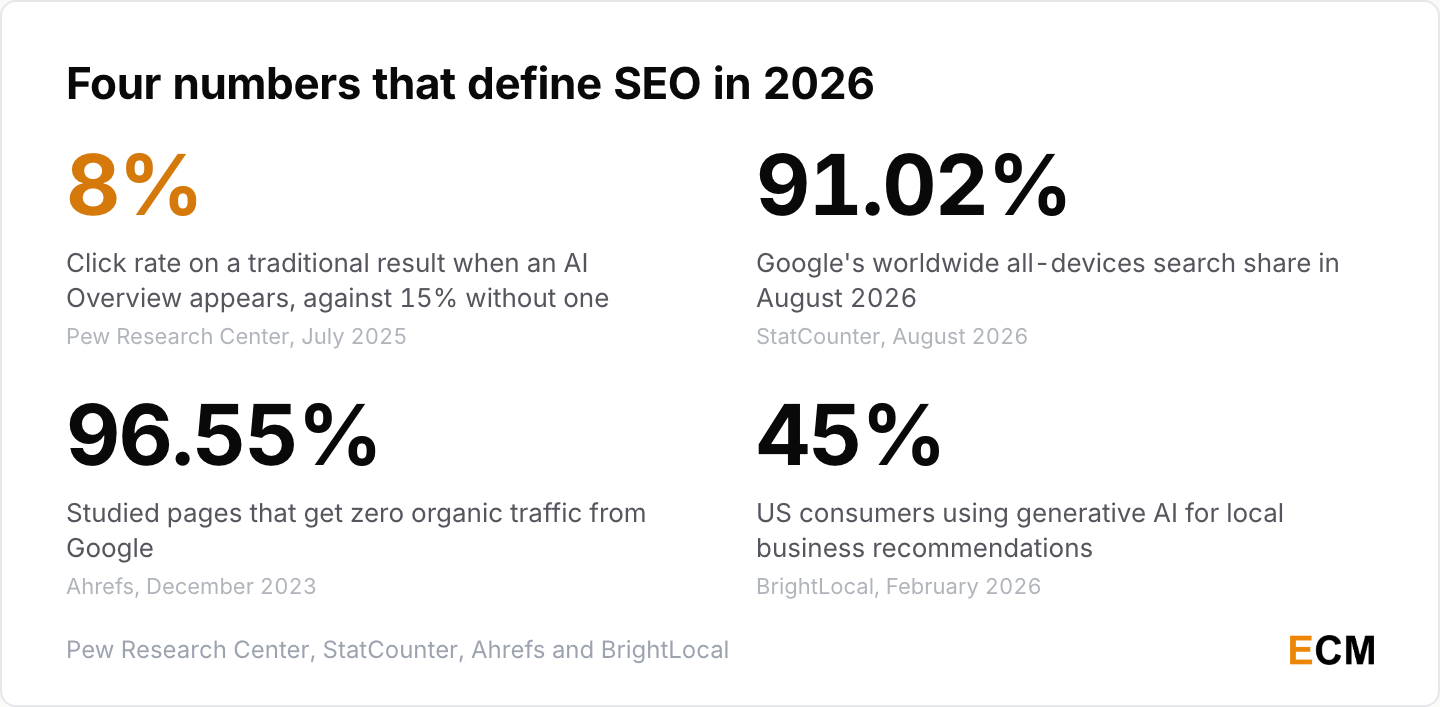
- AI Overviews roughly halve clicks where they appear. Traditional results get an 8% click rate with one present against 15% without (Pew Research Center, July 2025), and the top-ranking page takes a 58% hit to click-through rate (Ahrefs, February 2026).
- Google’s share recovered. It reached 91.02% by August 2026 after bottoming at 89.34% in October 2024 (StatCounter).
- Nobody agrees how often AI Overviews appear, and the panel is why. 18% of real user searches (Pew, July 2025), 15.69% of a keyword panel (Semrush, December 2025), over 11% of enterprise queries (BrightEdge, May 2025).
- Most content earns nothing. 96.55% of pages get zero organic traffic from Google (Ahrefs, December 2023) and 94% of blog posts have zero external links (Backlinko and BuzzSumo, February 2019).
- Local search moved fastest. US consumers using generative AI for local business recommendations went from 6% to 45% in a single year (BrightLocal, February 2026).
- Organic search still pays the bills, and clicks feed the algorithm. Organic is 53.3% of all website traffic (BrightEdge, 2019), and NavBoost re-ranks results on a rolling 13 months of click data (Search Engine Land on the US v. Google trial, 2023).
AI Overviews and Zero-Click Search Statistics
This is where search actually changed, and the firms measuring Google AI Overviews still disagree about how much.
How Often AI Overviews Appear
Trigger rates depend entirely on whose keyword universe you ask, so every number here carries its panel. Several come from Semrush, which is one vendor’s slice of search rather than the whole of it.
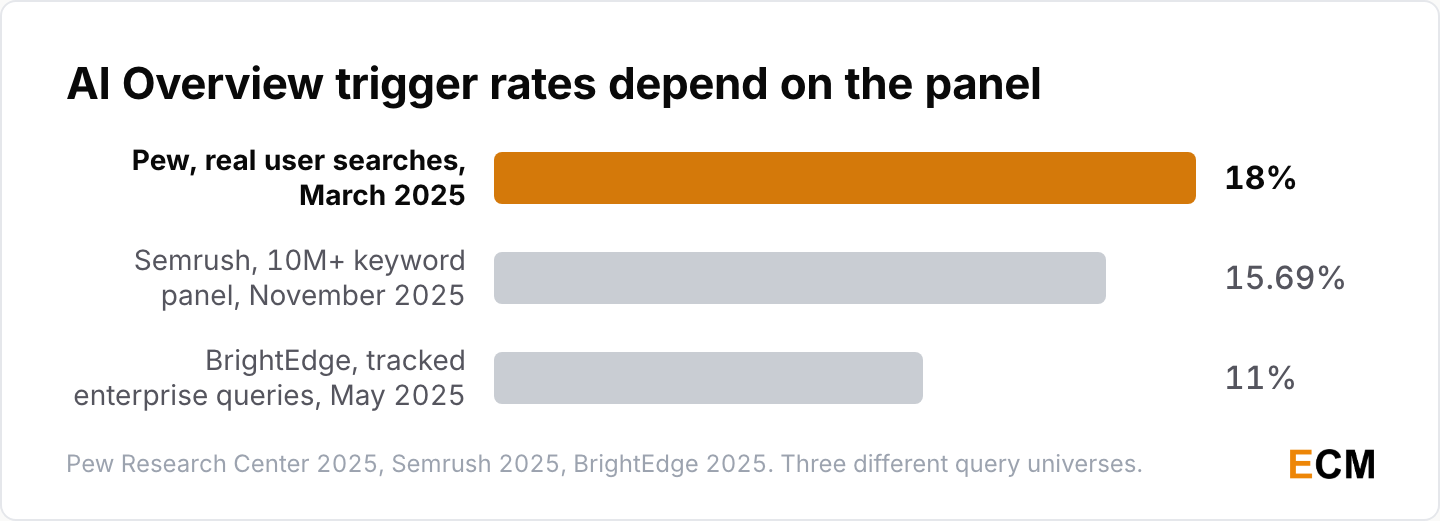
- The trigger rate depends entirely on the panel: 18% of all March 2025 searches and 60% of question-style searches in Pew’s study of real users (Pew Research Center, July 2025), 15.69% of a keyword panel in November 2025 (Semrush, December 2025), and over 11% of tracked enterprise queries (BrightEdge, May 2025).
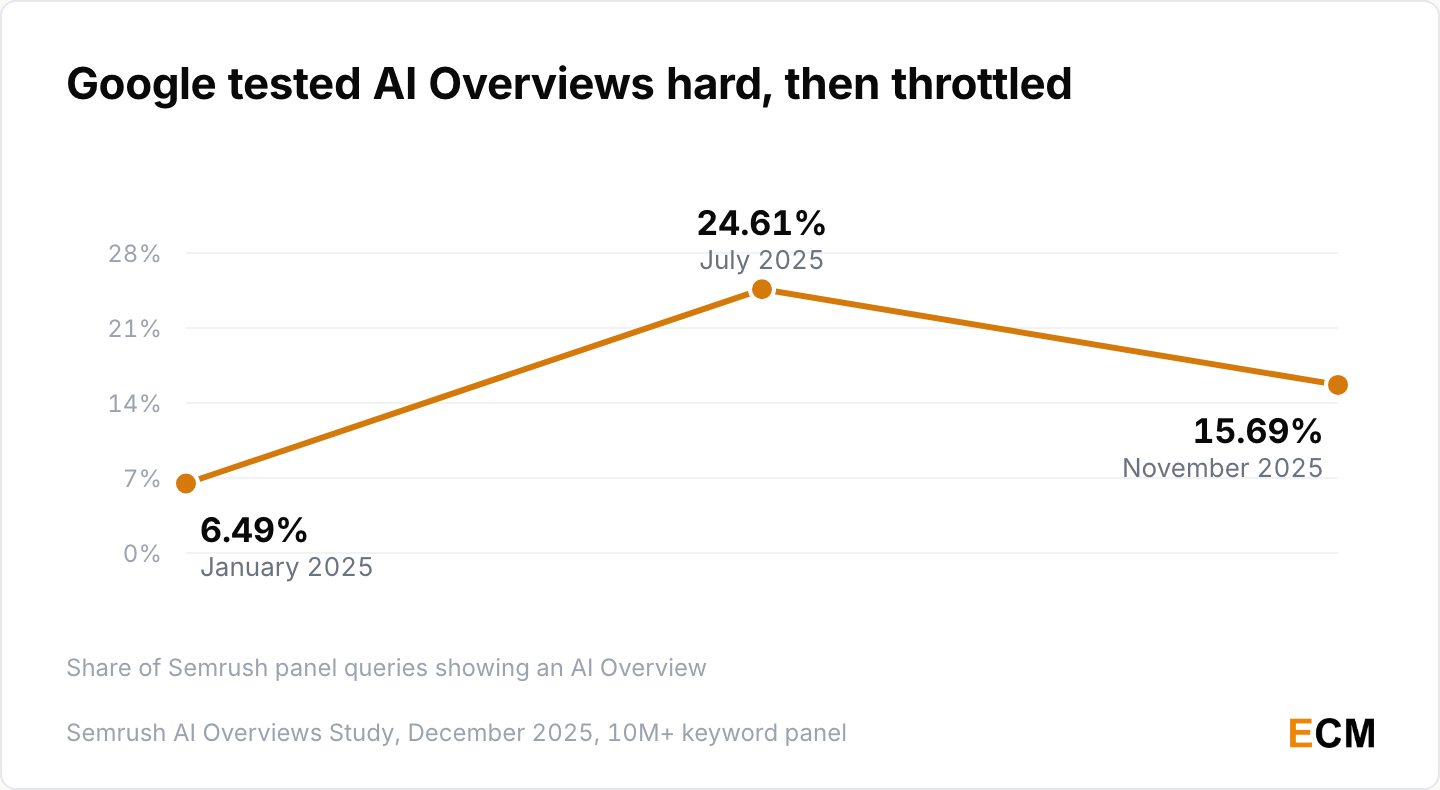
- Google tested aggressively, then throttled: AI Overview presence in Semrush’s 10M+ keyword panel climbed from 6.49% in January 2025 to 24.61% in July, then settled at 15.69% by November (Semrush, December 2025).
- Even branded and commercial search results pages now intersect with AI summaries. Navigational queries triggering an AI Overview grew from 0.84% in October 2024 to 10.33% a year later, and ads at the bottom of an AI Overview search results page went from under 1% in March 2025 to 25% by late 2025 (Semrush, December 2025).
What AI Overviews Do to Clicks
Being cited inside an AI Overview is visibility, not traffic. Check whether your pages even appear with the AI Overview checker before you model the damage.
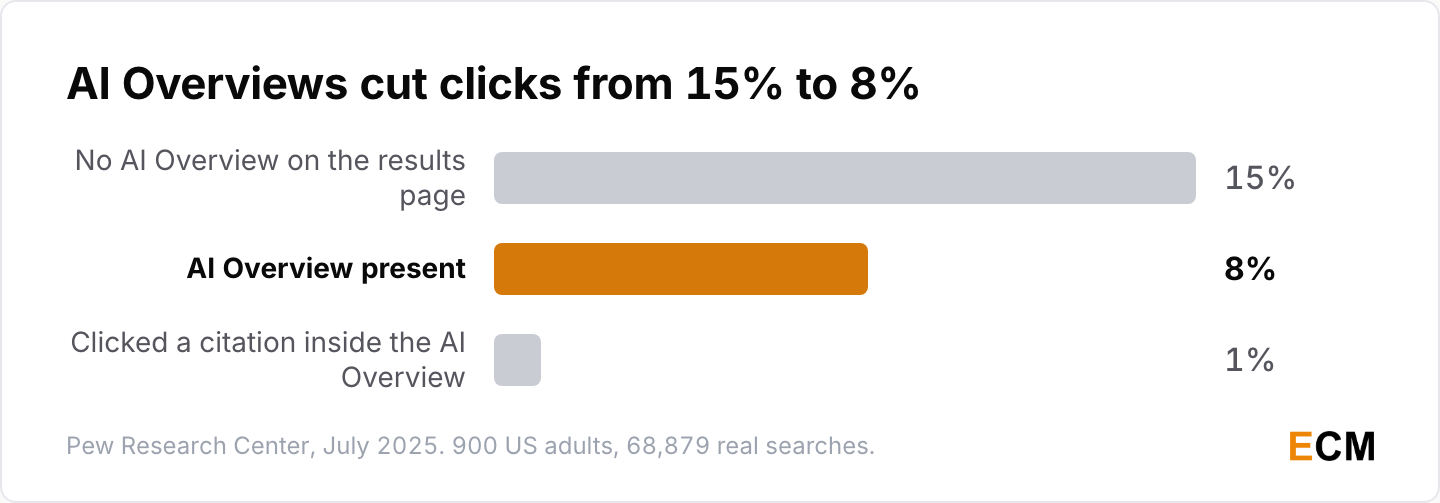
- Clicks on traditional results fall from 15% to 8% when an AI Overview is present, and only 1% of users click a citation inside the summary (Pew Research Center, July 2025, 900 US adults across 68,879 real searches).
- Sessions end sooner as well: 26% of searches with an AI Overview ended with the user leaving Google entirely, against 16% of sessions without one (Pew Research Center, July 2025).
- Correlation studies and same-keyword studies disagree, which tells you the honest answer is “it depends on the query”: Ahrefs measures a 58% lower click-through rate for the top-ranking page, up from 34.5% in its earlier study (Ahrefs, February 2026, 300,000 keywords), while Semrush tracked the same keywords before and after and saw zero-click rates slip from 33.75% to 31.53% (Semrush, December 2025).
- Readers are not universally sold either. 53% of Americans have at least some trust in AI summaries while 28% find them not too useful or not useful at all (Pew Research Center, October 2025, 5,153 US adults).
Zero-Click Rates and Where Clicks Go
Zero-click numbers vary by panel. One counts mobile, the other doesn’t, and the newest reading is the worst yet.
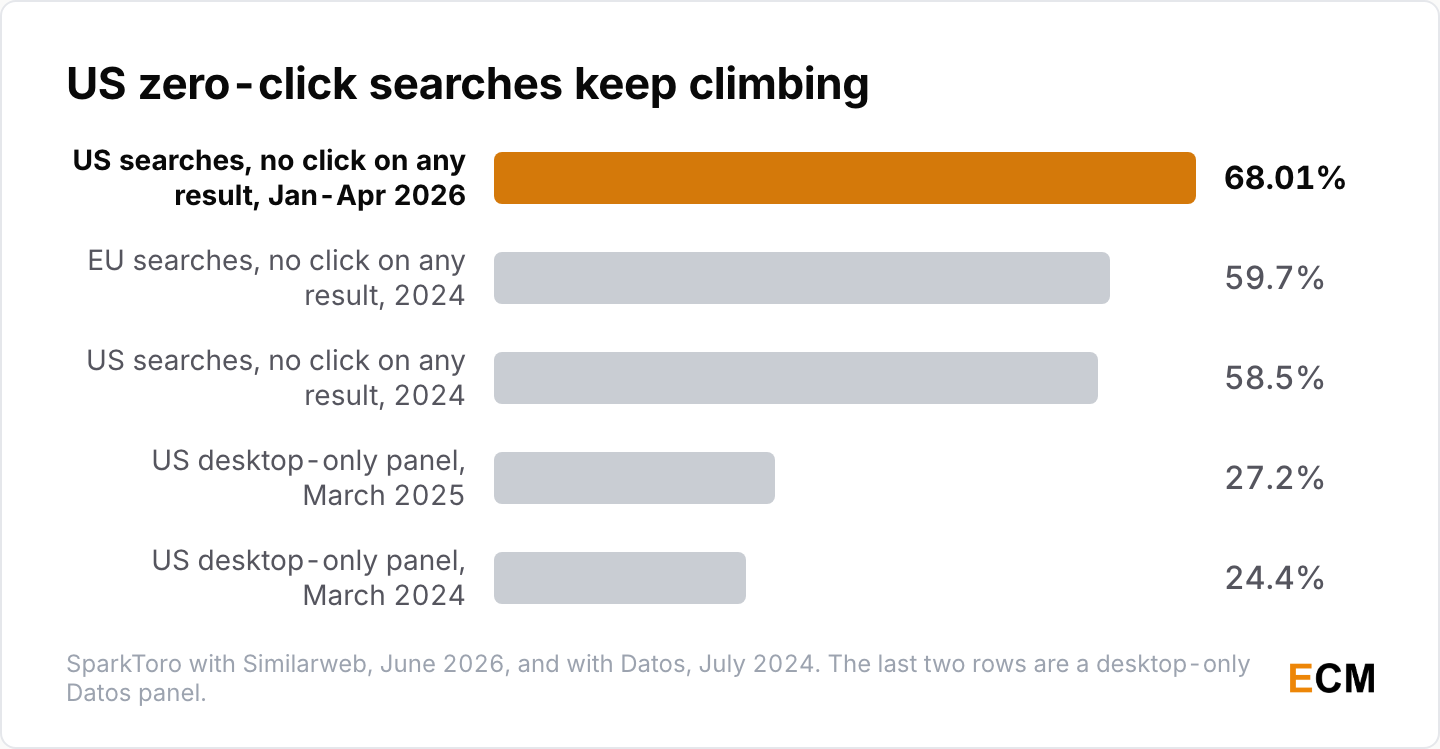
- The higher number weights desktop and mobile together: 58.5% of US Google searches and 59.7% of EU searches ended without a click on any result in 2024 (SparkToro and Datos Zero-Click Study, July 2024, a clickstream panel of tens of millions of desktop and Android users). The 2026 rerun on a Similarweb panel puts US zero-click at 68.01% for January to April 2026 (SparkToro and Similarweb, June 2026).
- Of every 1,000 US Google searches only 360 clicks reached the open web, 374 in the EU, and almost 30% of US clicks went to Google-owned properties like YouTube and Google Maps (SparkToro and Datos, July 2024).
- Desktop on its own looks far healthier: 27.2% of US desktop Google searches ended with no click in March 2025, up from 24.4% a year earlier, while organic clicks fell to 40.3% of US Google sessions from 44.2% (Datos State of Search Q1 2025 via Search Engine Land, May 2025, a panel of tens of millions of desktop users; Datos is Semrush-owned).
- Attention has barely moved toward AI: US users spent 10.55% of their online time on traditional search engines against 0.55% on AI tools (Datos State of Search Q1 2025 via Search Engine Land, May 2025).
How AI Platforms Compare With Google
Referral traffic from AI search tools is growing fast off a small base, and so far it looks additive rather than substitutive.
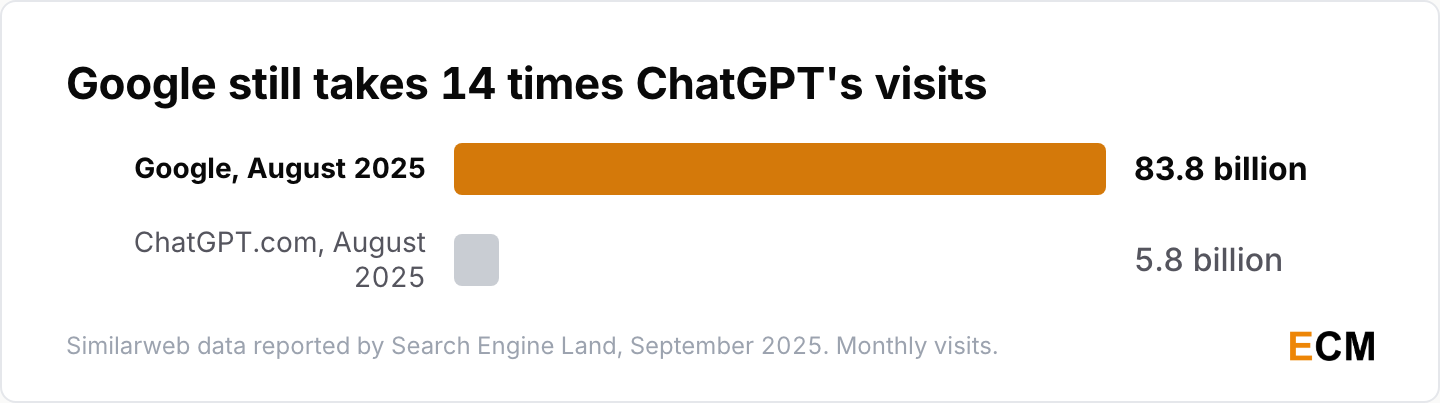
- Google took about 83.8 billion visits in August 2025 against ChatGPT.com’s 5.8 billion, roughly 14 times as many, and 95.3% of ChatGPT visitors also visited Google that month while only 14.3% of Google visitors visited ChatGPT (Similarweb data reported by Search Engine Land, September 2025).
- AI platforms still generated more than 1.1 billion referral visits in June 2025, up 357% year over year (Similarweb 2025 Generative AI Landscape, December 2025; panel-modeled, so read it as directional).
- The share that is moving is moving between AI tools, not away from search. ChatGPT’s slice of worldwide generative AI web traffic slid from roughly 76% to about 53% between June 2025 and May 2026 while Google Gemini climbed from under 9% to roughly 27% (Similarweb, updated July 2026).
Google Search Engine Market Share Statistics
Google still dominates, and the 2024 to 2026 trend line has a shape most SEO stats roundups miss.
Google’s Share Dipped Then Recovered
The “Google is collapsing” story of early 2025 didn’t hold up against the next seventeen months of data.
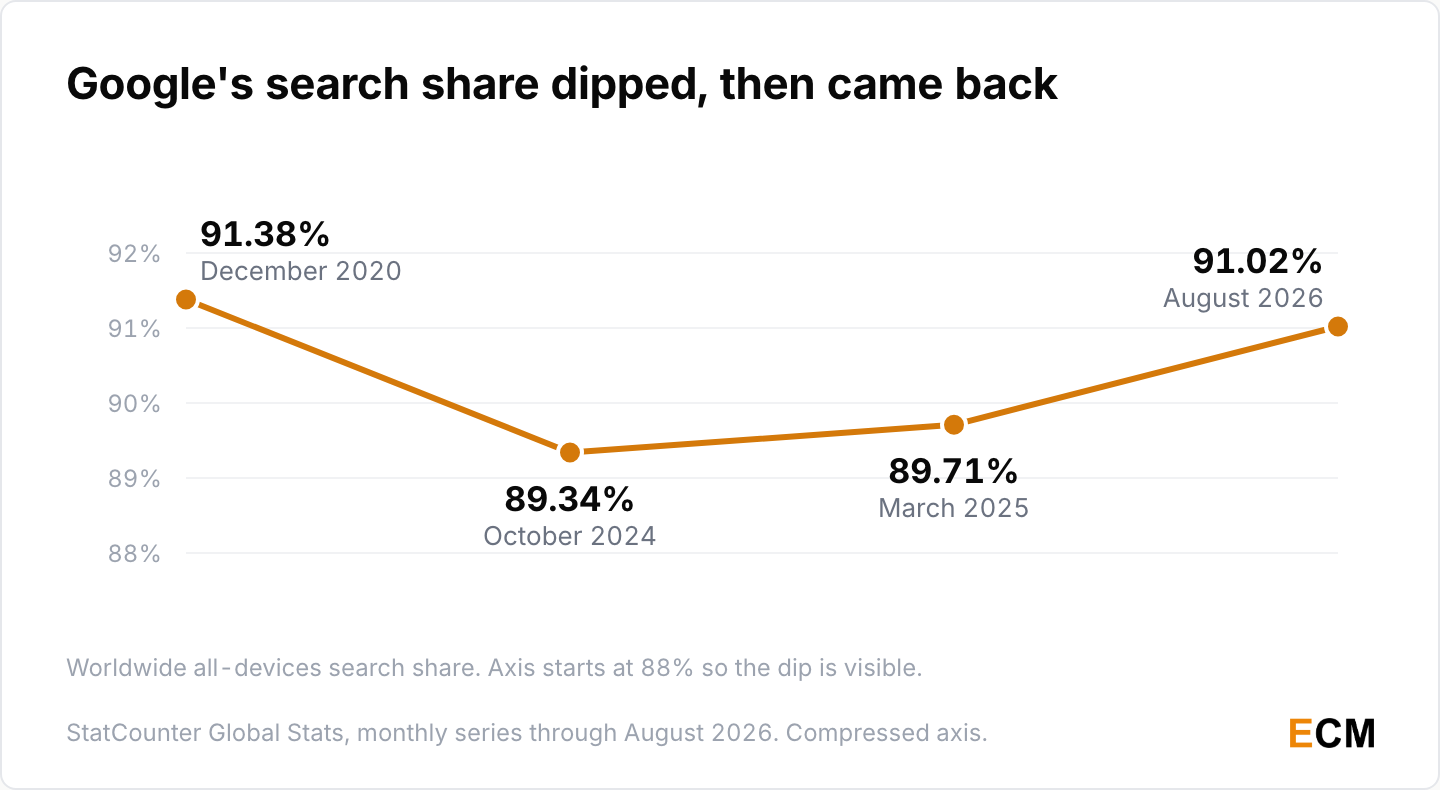
- Google’s worldwide all-devices share bottomed at 89.34% in October 2024, sat at 89.71% in March 2025, and recovered to 91.02% by August 2026 (StatCounter Global Stats, monthly series through August 2026).
- Go back far enough and almost nothing moved: Google held 91.38% worldwide in December 2020 (StatCounter), within half a point of where it sits today.
- The challengers stayed small. Bing and Yandex held 4.55% and 1.01% worldwide in August 2026, against 4.01% and 2.51% in March 2025 (StatCounter).
- Desktop is the one place Bing competes: Google’s desktop-only share fell to 79.1% in March 2025 while Bing reached 12.21%, and on mobile Google never blinked, holding between 93.74% and 95.11% through 2025 and reaching 96.04% by mid-2026 (StatCounter, desktop and mobile views).
- One caveat applies to every share number here. StatCounter measures search referrals to sites running its code, not queries, so Google’s measured share can fall while its query share holds.
How Big Google Search Still Is
Demand is growing, not shrinking, which is exactly why impressions rose while clicks fell.
- Total search impressions grew more than 49% in the year after AI Overviews launched while click-throughs declined nearly 30% (BrightEdge, May 2025, enterprise keyword panel; vendor-published).
- Google search volume grew 21.64% from 2023 to 2024 (SparkToro on the Datos panel, March 2025, US desktop panel). The much-quoted 3.5 billion searches a day, roughly 40,000 every second (Internet Live Stats), extrapolates from an old Google disclosure; Google’s own count is now more than 5 trillion searches a year (Google, 2025).
- The web underneath keeps growing too. Q2 2026 closed with 401.6 million registered domains across all top-level domains, up 8.1% year over year, with .com and .net accounting for 179.1 million of them (Verisign Domain Name Industry Brief, July 2026).
Ranking and Click-Through Rate Statistics
Two click-through rate datasets built on different panels, plus the antitrust trial disclosures that changed how SEO strategies treat clicks.
CTR by Google Ranking Position
On a clean Google search results page the top three still take roughly two thirds of the clicks.
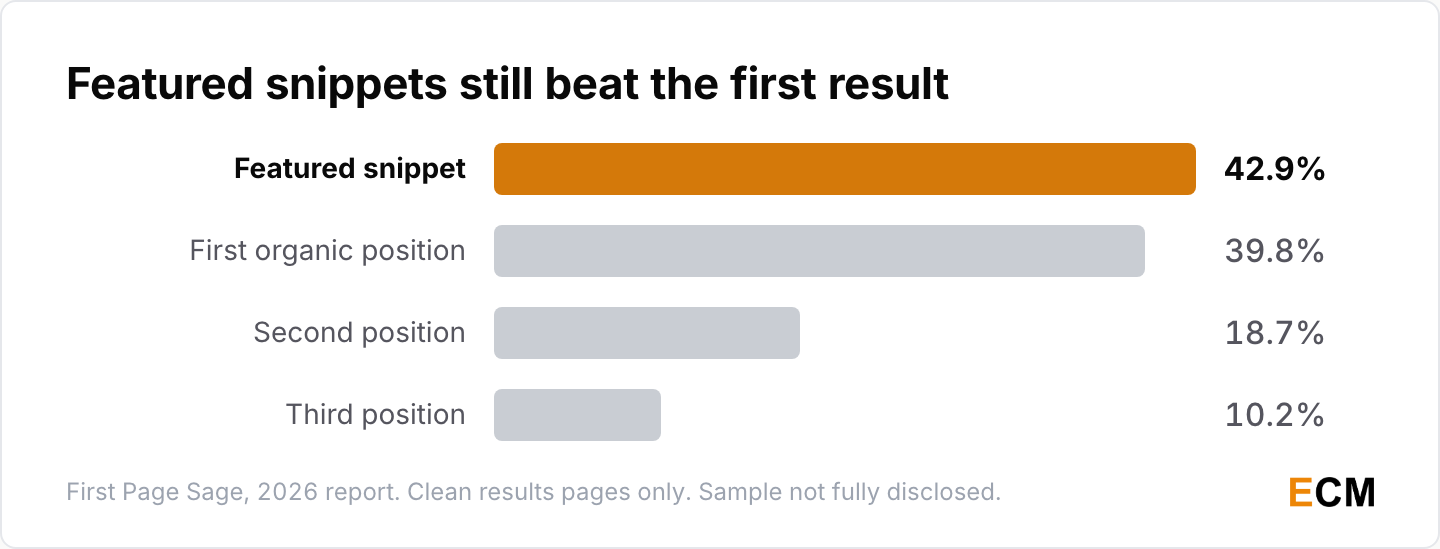
- On a search results page with no AI Overview, map pack or rich feature, the first organic position takes 39.8%, the second takes 18.7% and the third takes 10.2%, or 68.7% of clicks across the top three (First Page Sage, 2026 edition, last updated May 2025; meta-analysis, sample not fully disclosed).
- Featured snippets pull 42.9%, the highest of any single search result element, and the top organic result draws roughly 19x more clicks than the top paid result (First Page Sage, 2026 edition).
- Page two barely gets clicked at all. Backlinko’s study of 5 million results put second-page click-through rate at 0.78% in 2019, and the current edition puts it at 0.63%.
How CTR Is Shifting Year Over Year
Clicks are spreading downward, even on branded searches, and that’s the part I’d plan around.
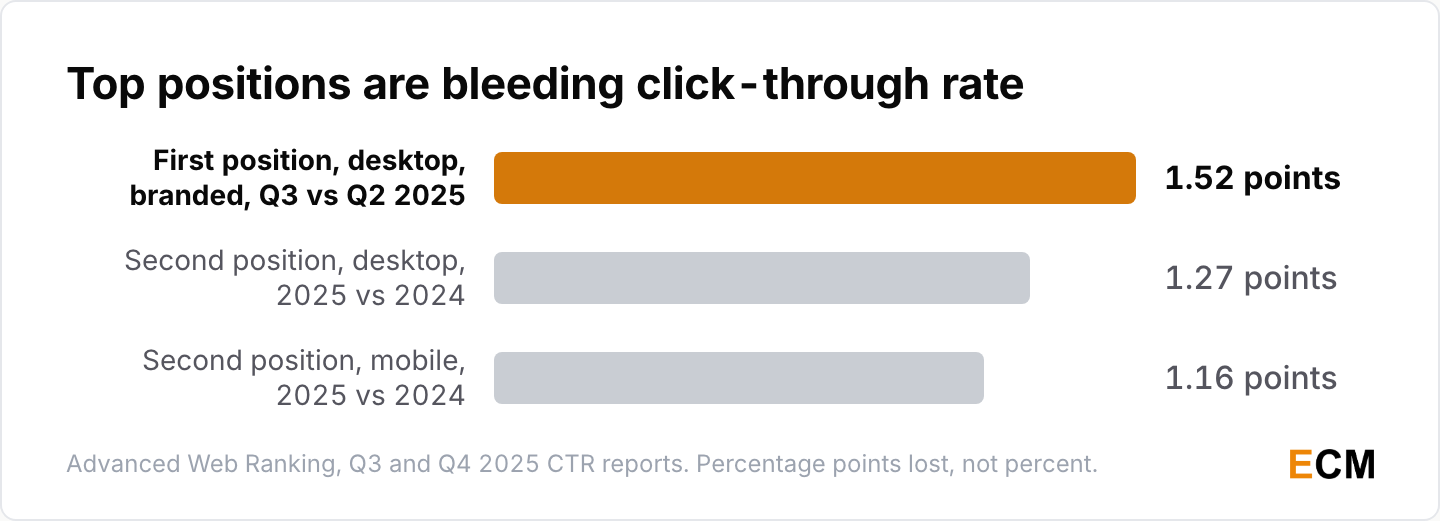
- Comparing 2025 against 2024, the second position lost 1.27 points of click-through rate on desktop and 1.16 points on mobile, measured in percentage points (Advanced Web Ranking Q4 2025 CTR report; Search Console aggregation across millions of keywords).
- On branded search results pages the first desktop position lost 1.52 points between Q2 and Q3 2025 while positions two through six gained a combined 8.71 points, and queries of four or more words were the only group holding steady (Advanced Web Ranking Q3 2025 CTR report).
What the Antitrust Trial Confirmed
The 2023 trial disclosed more ranking specifics than a decade of Google blog posts, and the practical lesson is that what users do after the click is a real input.
- NavBoost, one of Google’s strongest signals, re-ranks results using click data from a rolling 13-month window, and its counterpart Glue does the same job for search results page features by aggregating clicks, hovers, scrolls and swipes into one metric (Search Engine Land on Pandu Nayak’s October 2023 testimony and the Oard exhibit).
- Google’s index held roughly 400 billion documents as of 2020, and Nayak put the number of ranking signals at more than a hundred, well short of the “200+ signals” the industry repeated for years (Nayak testimony).
- DOJ exhibits released in 2025 filled in the rest of the stack: anchors, body and clicks combine into a topicality signal, a quality score and a Chrome-data popularity signal sit alongside it, and the machine-learned layer runs RankBrain, then DeepRank, then RankEmbed (Search Engine Land on the remedies-hearing exhibits, May 2025).
Content, Keyword, and Link Building Statistics
The most repeated of all SEO stats still holds after a decade. It just got worse.
Who Gets Organic Search Traffic
Three editions of the same Ahrefs study, and almost all the damage landed in the last one.
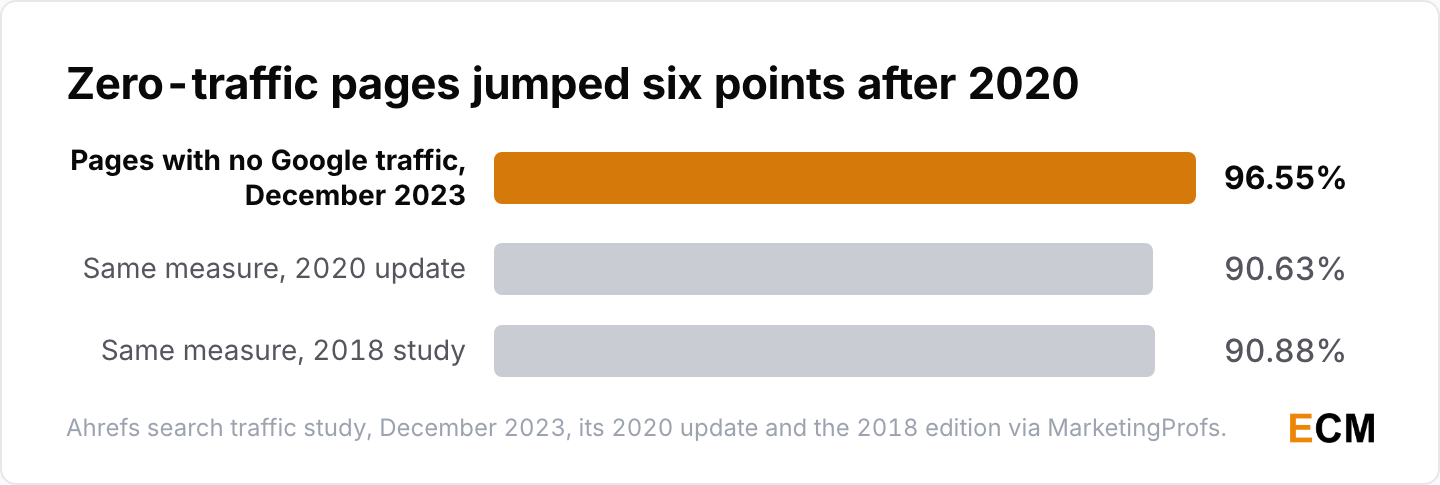
- 96.55% of studied pages get zero organic traffic from Google and just 1.94% get between one and ten monthly visits (Ahrefs, December 2023, roughly 14 billion pages; the study predates AI Overviews, so treat it as a floor).
- The measure sat flat for two editions, then jumped almost six points. The 2018 edition put it at 90.88% across 920 million pages (MarketingProfs on Ahrefs, 2018) and the 2020 update put it at 90.63% (Ahrefs, 2020 edition).
- For the pages that do earn traffic, organic search is still the largest single channel at 53.3% of all website traffic (BrightEdge Channel Share research, 2019, still the most recent edition and measured before AI Overviews).
Backlink Distribution Across the Open Web
Links concentrate at the very top, and the shape hasn’t moved in a decade.
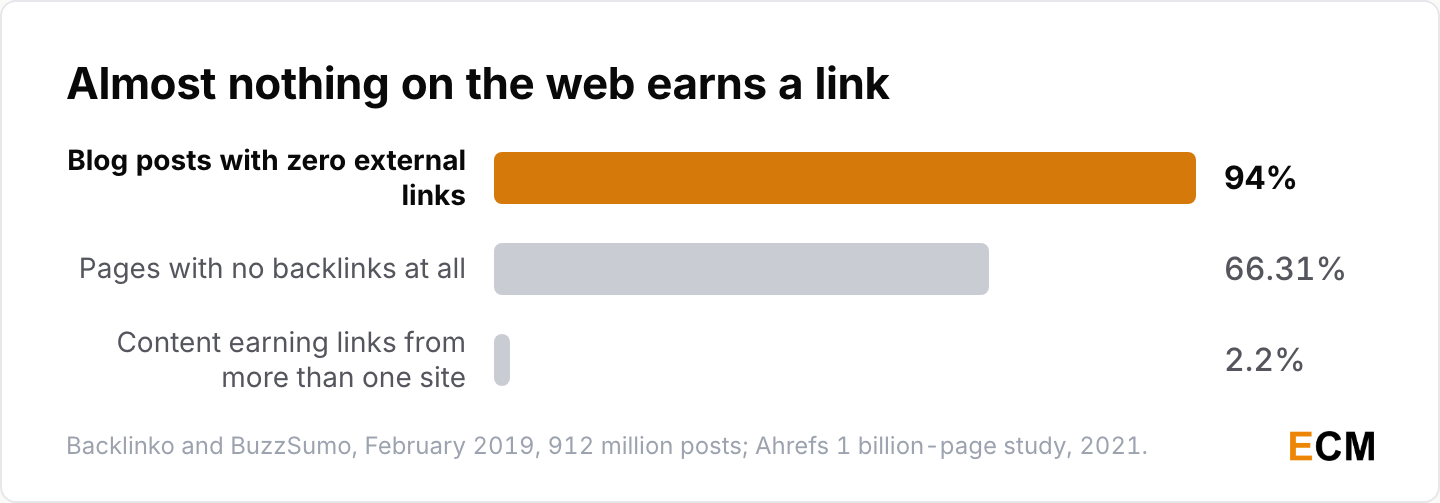
- 94% of all blog posts have zero external links and only 2.2% of content generates links from more than one website (Backlinko and BuzzSumo, February 2019, 912 million blog posts).
- Ahrefs’ analysis of a billion pages found 66.31% had not a single backlink (Search Engine Roundtable, March 2021), while 73.6% of domains with at least 10,000 monthly organic visits have reciprocal links (Ahrefs, 140,592 domains).
- The people doing the work still expect links to matter: 94% of SEO professionals believed links will be a Google ranking factor in five years and 73% believed so for ten years out, with 32% saying a single link takes one to two hours to build (Aira State of Link Building, 2022, 270 SEO professionals).
The 80/20 Split in Search Demand
Demand, traffic and sharing all concentrate the same way, which is why the long tail is where your entry points are.
- Search demand concentrates hardest of all. 0.16% of the most popular keywords, the ones with 1,001 or more monthly searches, generate 60.67% of all search demand, leaving the remaining 99.84% of queries to split what is left (Ahrefs keyword study, 2020, 1.9 billion keywords).
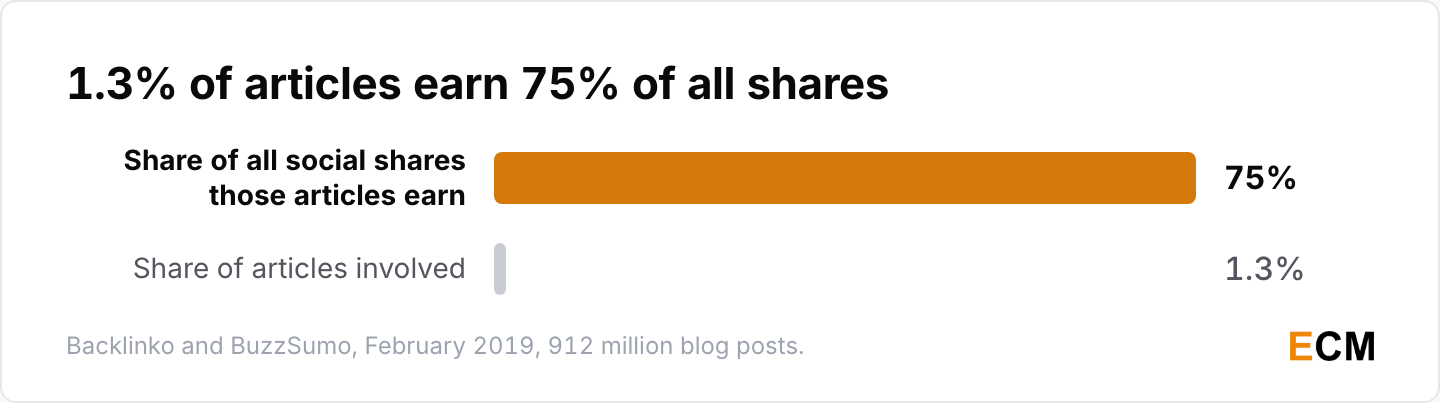
- Sharing is just as concentrated: 1.3% of articles generate 75% of all social shares (Backlinko and BuzzSumo, February 2019, 912 million blog posts).
- Organic traffic concentrates the same way. Only 3.45% of pages get any Google traffic at all, and just 1.94% get between one and ten monthly visits (Ahrefs, December 2023).
- About 8% of search queries are phrased as questions, Google-owned properties earned 11.8% of clicks from distinct searches with YouTube alone drawing 1.8%, and organic offered roughly 20x more traffic opportunity than paid (Moz and Jumpshot clickstream analysis, 2017).
Local, Mobile, Voice, and Video SEO Statistics
Local behavior is shifting faster than anything else in this roundup, and the mobile and voice numbers below are a decade old.
Local SEO and Review Statistics
Generative AI became a mainstream local recommendation source in a single year, which is the fastest move in this whole roundup.
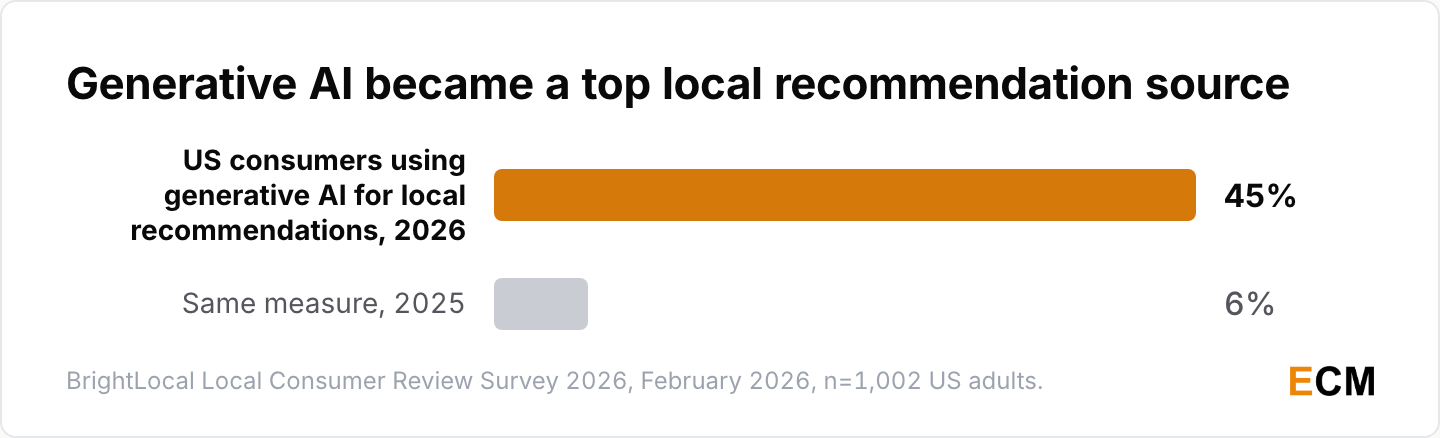
- US consumers who use AI tools like ChatGPT for local business recommendations went from 6% in 2025 to 45% in 2026, making AI the third most popular source of business recommendations (BrightLocal Local Consumer Review Survey 2026, February 2026, n=1,002 US adults).
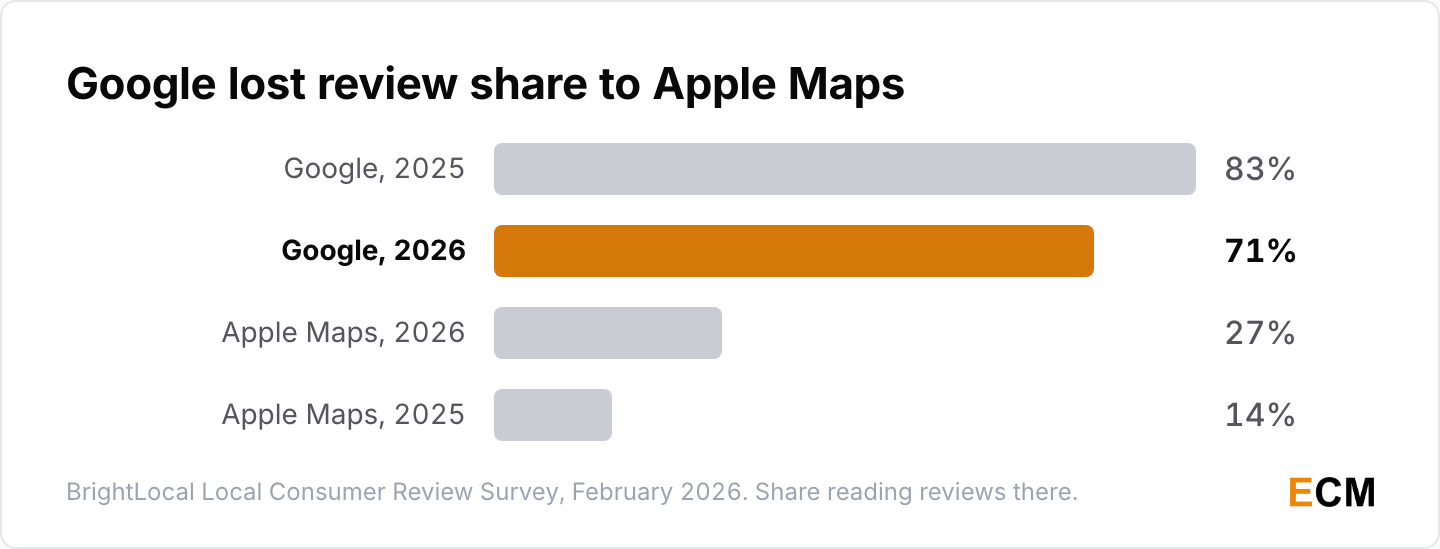
- Google’s share as a review source dropped from 83% in 2025 to 71% in 2026 while Apple Maps use for reading reviews nearly doubled, from 14% to 27% (BrightLocal, February 2026).
- Reviews are now close to universal reading: 97% of consumers read them when browsing for businesses and 41% say they always do, up from 29% a year earlier, yet only 35% of small and medium businesses have a Google Business Profile (BrightLocal, February 2026).
- Against the 2020 edition of the same survey, 93% of consumers used the internet to find a local business, 87% read reviews and 94% said positive reviews made them more likely to use a business (BrightLocal 2020, n=1,013).
- Whether a business is open at the time of search ranks fifth among local pack signals (Whitespark Local Search Ranking Factors, November 2025, 47 local SEO experts; expert consensus rather than correlation data).
Mobile Search Behavior Statistics
Every number here was measured between 2016 and 2018.
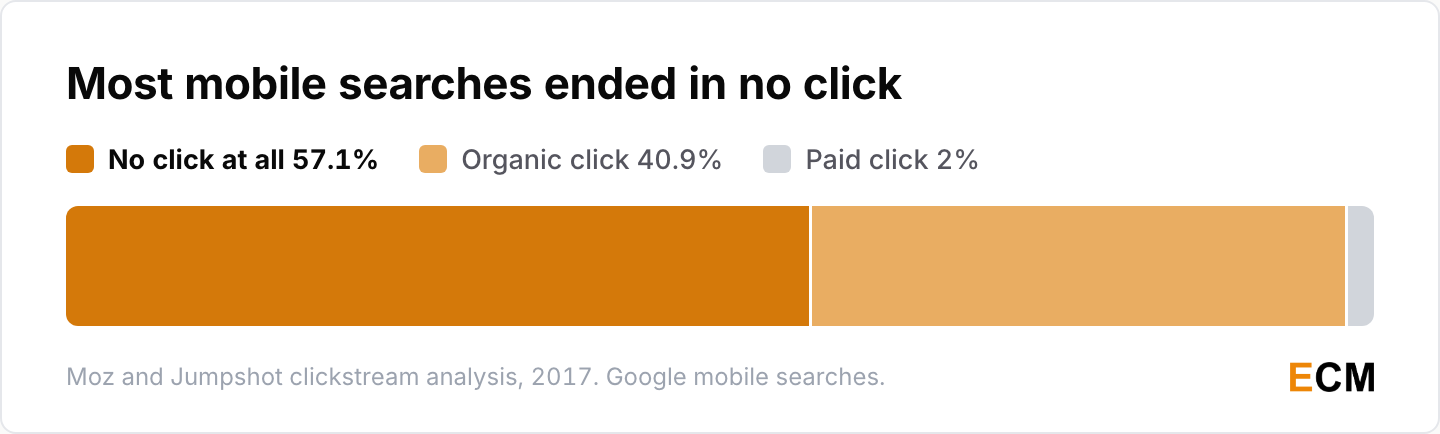
- Jumpshot’s clickstream data split Google mobile searches three ways: 57.1% ended in no click at all, 40.9% in an organic click and 2% in a paid click (Moz and Jumpshot, 2017).
- Mobile accounted for roughly 58% of overall US search query volume across 11 categories in Hitwise’s 2016 report (Search Engine Land), and Google showed just 8.5 organic links on page one of mobile results (Searchmetrics 2018 Universal Search study, roughly 500,000 queries).
- Google’s own 2016 mobile research put 30% of all mobile searches as location related, with 76% of people searching for something nearby visiting a business within a day, 28% of those nearby searches ending in a purchase, and 1.5 billion destinations visited monthly as a result (Think with Google, 2016).
Voice Search Statistics and Video Data
Voice SEO was never a separate discipline, and the most quoted voice number has no current source behind it.
- Backlinko’s study of 10,000 Google Home results found the mean Ahrefs Domain Rating of a voice answer was 76.8, the typical answer ran 29 words at a ninth-grade reading level, the source page averaged 2,312 words, and about 75% of answers came from a page already in the desktop top three (Backlinko, 2018).
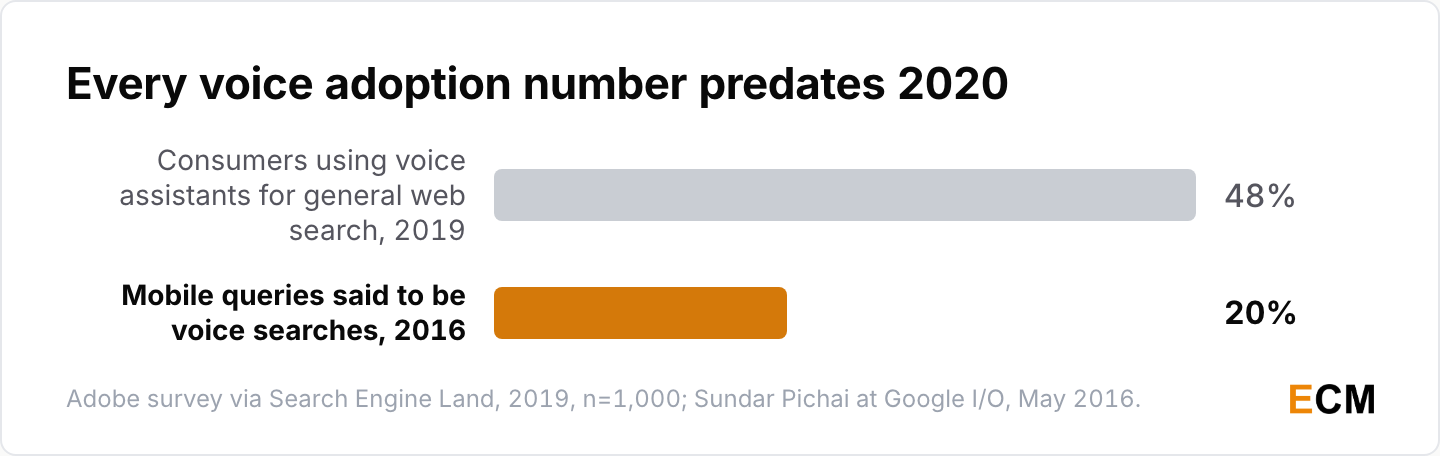
- Every adoption claim predates 2020. 48% of consumers reported using voice assistants for general web search (Adobe survey via Search Engine Land, 2019, roughly 1,000 US adults), 27% of the global online population was using voice search on mobile (GlobalWebIndex Voice Search Insight Report, 2018), and the “20% of mobile queries are voice searches” line comes from a May 2016 Sundar Pichai statement Google has not updated since.
- Video’s durable findings are older but unchallenged: comment count, view count, shares and likes all correlated with higher rankings in Backlinko’s analysis of 1.3 million YouTube videos (2017), and YouTube’s recommendation algorithm points viewers toward progressively longer videos (Pew Research Center, November 2018).
Technical SEO and SEO Industry Statistics
The HTTP Archive Web Almanac is the strongest primary source for what the web actually ships, based on a 2024 crawl of 16.9 million websites, and it sets the floor for technical SEO performance.
Technical Adoption Across the Web
Basic hygiene is more common than the discourse suggests, and the mistakes that remain are dull ones.
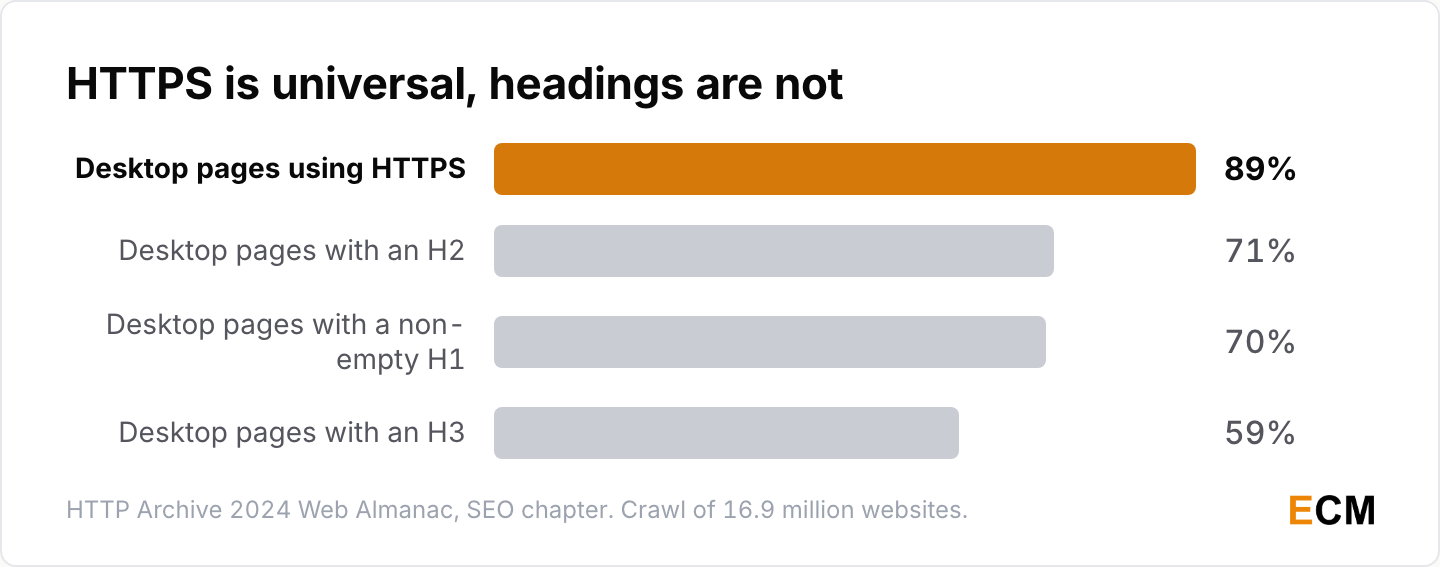
- 89% of desktop pages and 88.9% of mobile pages used HTTPS in 2024, while 70% of desktop pages have a non-empty H1, 71% have an H2 and 59% have an H3 (HTTP Archive 2024 Web Almanac).
- The errors that persist are unglamorous. 10.6% of desktop pages ship invalid HTML in the document head, and a stray image tag causes 29% of those cases on desktop and 22% on mobile; div-in-head errors jumped from 4% in 2022 to roughly 11% in 2024, and the two most-used meta robots “rules” were “follow” and “index”, neither of which Googlebot acts on (HTTP Archive 2024).
- Page weight is steadier than it feels: the median page carries 14.5 images, with home pages averaging 18.5 and inner pages 10.5 (HTTP Archive 2024).
- Interaction to Next Paint replaced First Input Delay as a Core Web Vital on March 12, 2024 (web.dev), with 200ms or below counting as good and above 500ms as poor (web.dev). The March 2024 core update (Google Search Central) targeted a 40% reduction in low-quality results, which Google later reported as 45% (Google, 2024; Google’s own measure).
SEO Costs and SEO ROI Statistics
SEO ROI starts with what the work actually costs.
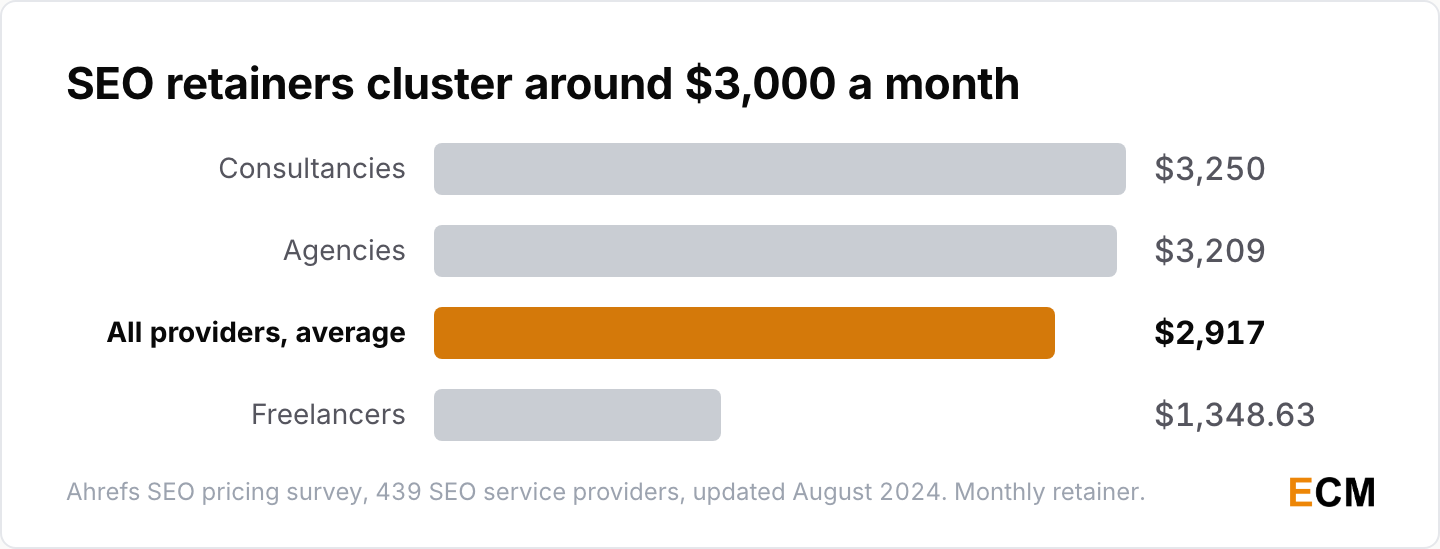
- SEO costs $2,917 a month on average, with freelancers at $1,348.63, agencies at $3,209 and consultancies at $3,250 (Ahrefs SEO pricing survey, 439 SEO service providers, updated August 2024).
- The average hourly rate is $111, and $75 to $100 an hour is the single most popular band at 24% of respondents (Ahrefs, 439 providers).
- 91% of respondents said SEO positively impacted website performance and overall marketing goals (Conductor State of Organic Marketing, 2025 edition, 350+ digital marketing, SEO and content marketing professionals; vendor-published).
For the content side of these numbers, see the companion content marketing statistics and the SEO writing guide.
Frequently Asked Questions
What is the 80/20 rule in SEO?
In search it is closer to 97/3. 96.55% of pages get zero organic traffic from Google and only 3.45% get any at all (Ahrefs, December 2023). Sharing concentrates the same way: 1.3% of articles earn 75% of all social shares (Backlinko and BuzzSumo, February 2019). The head is unwinnable for most sites, so the long tail is where your entry points are.
What are SEO metrics?
The measurements that actually move budget are click-through rate by position, zero-click rate and AI Overview trigger rate. On a clean Google search results page the first organic position takes 39.8% (First Page Sage, 2026), 68.01% of US searches ended with no click at all in early 2026 (SparkToro and Similarweb, June 2026), and AI Overviews showed on 15.69% of a keyword panel (Semrush, December 2025).
What are the four main types of SEO?
Content, technical, off-page and local, and this page has a number for each. Content: 96.55% of pages get no organic traffic (Ahrefs, December 2023). Technical: 89% of desktop pages use HTTPS (HTTP Archive, 2024). Off-page: 94% of blog posts have zero external links (Backlinko and BuzzSumo, February 2019). Local: 97% of consumers read reviews (BrightLocal, February 2026).
Is 75 a good SEO score?
There is no published benchmark, so treat any tool score as relative. Semrush defines Site Health as the share of crawl checks a site passes and publishes no “good” threshold (Semrush). Real-web adoption is the better yardstick: 89% of desktop pages use HTTPS and 70% have a non-empty H1 (HTTP Archive, 2024). If you clear those and your pages are indexed, the score matters less than the rankings you earn.
What percentage of website traffic comes from organic search?
Organic search delivers 53.3% of all website traffic, more than any other channel (BrightEdge Channel Share research, 2019, still the most recent edition of that measurement). That share sits alongside a harsher fact about which pages get it: 96.55% of studied pages get zero organic traffic from Google at all (Ahrefs, December 2023, roughly 14 billion pages). Channel dominance and page-level odds are two different questions.
What percentage of searches result in zero clicks?
Two answers, depending on the panel. 58.5% of US Google searches ended without a click on any result in 2024, rising to 68.01% across January to April 2026 (SparkToro and Datos, July 2024; SparkToro and Similarweb, June 2026). A desktop-only panel measured 27.2% for March 2025 (Datos, May 2025).
How does AI impact SEO and search behavior?
It compresses clicks without shrinking search. Clicks on traditional results fall from 15% to 8% when an AI Overview appears and only 1% of users click a citation inside it (Pew Research Center, July 2025), while total impressions grew over 49% in the year after launch (BrightEdge, May 2025). More visibility, fewer clicks per unit of it.
Why do AI Overview statistics vary so much across sources?
Because every source measures a different universe. Pew watched real users and saw AI Overviews on 18% of searches (Pew, July 2025). Semrush samples a 10M+ keyword panel and gets 15.69% (Semrush, December 2025). BrightEdge tracks enterprise commercial keywords and reported over 11% (BrightEdge, May 2025). Pick the panel closest to your own query mix.
What is the average cost of SEO services and what is the ROI?
SEO costs $2,917 a month on average, ranging from $1,348.63 for freelancers to $3,250 for consultancies, at an average hourly rate of $111 (Ahrefs, 439 providers, updated August 2024). On returns, 91% of practitioners say the channel positively impacts website performance and marketing goals (Conductor, 2025), and organic carries 53.3% of all site traffic (BrightEdge, 2019). If you are investing in SEO, those figures price the effort; the returns are self-reported.
How important are backlinks and keywords for SEO ranking?
Links are still scarce enough to be a real differentiator: 94% of blog posts have zero external links (Backlinko and BuzzSumo, February 2019) and 66.31% of pages have no backlinks at all (Search Engine Roundtable, March 2021). Practitioners agree: 94% of SEO professionals expect links to remain a ranking factor in five years (Aira, 2022). On keywords, only 3.45% of pages earn any Google traffic (Ahrefs, December 2023), so targeting is a distribution problem.
What are the key statistics for local, mobile, and video SEO?
Local: generative AI as a recommendation source went from 6% to 45% of US consumers in a year, and 97% read reviews (BrightLocal, February 2026). Mobile: 57.1% of Google mobile searches ended in no click and 40.9% in an organic click (Moz and Jumpshot, 2017). Video: comments, views, shares and likes all correlate with higher YouTube rankings (Backlinko, 1.3 million videos, 2017).
What are the latest SEO trends and statistics for 2026?
Two things actually moved in the SEO statistics for 2026. AI Overview prevalence more than doubled across 2025, from 6.49% in January to 15.69% in November after a mid-year peak near 25% (Semrush, December 2025). And generative AI as a local recommendation source jumped from 6% to 45% of US consumers (BrightLocal, February 2026). Click-through rate by position, technical adoption and link distribution all drift slowly.
Does Google really use click data to rank pages?
Yes, and it stopped being speculation in 2023. Pandu Nayak confirmed under oath that NavBoost, which uses a rolling 13-month window of click data, is one of Google’s strongest ranking signals, and that Glue does the same for search results page features using clicks, hovers, scrolls and swipes (Search Engine Land on the US v. Google trial, 2023). Titles that earn the click now matter more than they did.
Written by
Editorial Staff
The Editorial Staff represents the writers, editors, and content creators who have worked (or work) at Elite Content Marketer. The experimenter-in-chief behind the team is Chintan Zalani, who has close to a decade of experience trying to make sense of the content marketing industry. Started in 2019, Elite Content Marketer is on a mission to help creators build sustainable businesses.