YouTube cleared more than $60 billion in revenue in 2025 (Alphabet Q4 2025 results). The YouTube statistics below cover audience, watch time, Shorts, advertising revenue and what creators keep.
53 YouTube Statistics Marketers Need to Know in 2026
 Written by Editorial Staff
Key Takeaways
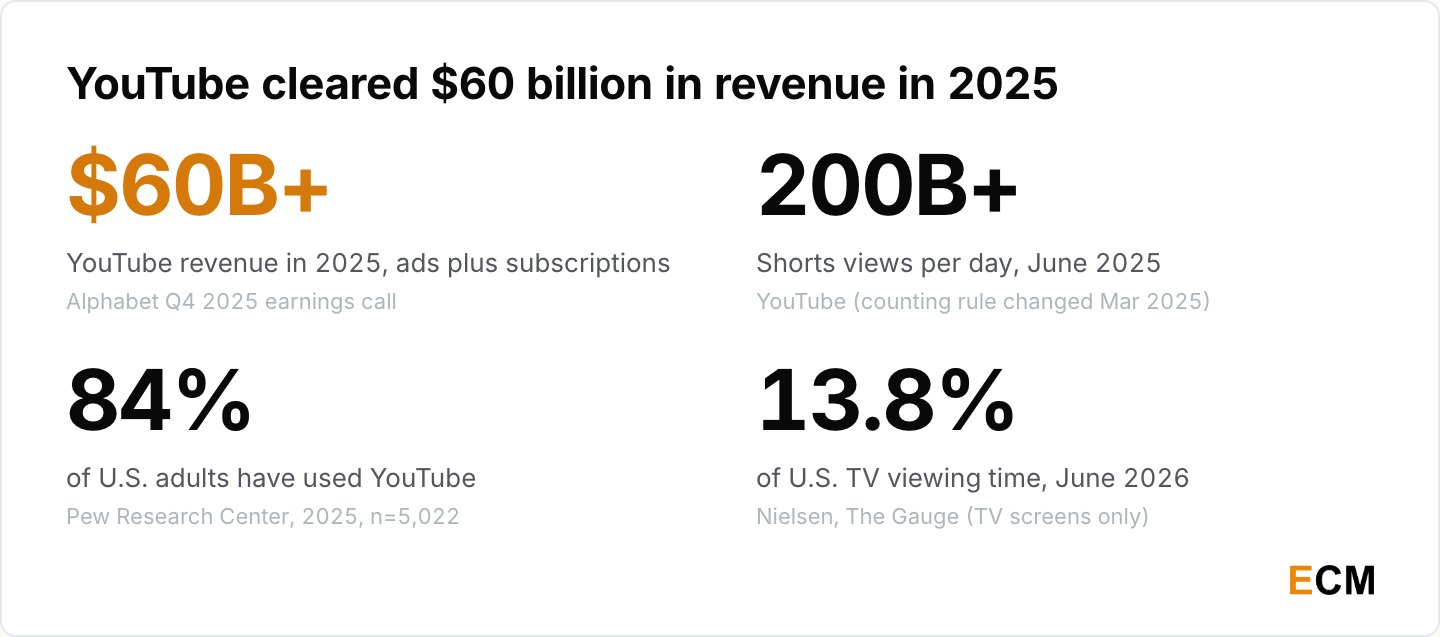
- YouTube passed $60 billion in revenue in 2025. Advertising alone was $11.4 billion in the fourth quarter of 2025 (Alphabet Q4 2025 results).
- The living room is the story, not the phone. YouTube took 13.8% of all U.S. television viewing time in June 2026, the largest share of any media company (Nielsen, The Gauge).
- Nobody outside Google knows YouTube’s user count. The 2.53 billion figure in circulation is advertising reach from Google’s own ad planner, not active users (DataReportal, Essential YouTube Stats, 2025).
- Shorts passed 200 billion daily views in June 2025 (YouTube, Cannes 2025), but the counting rule changed mid-run. From 31 March 2025 a play or replay counts, with no minimum watch time (YouTube Help).
- Creators keep 55% of net Watch Page ad revenue and 45% of their allocated share of a pooled Shorts fund (YouTube Partner Program earnings). YouTube paid more than $100 billion to creators, artists and media companies from 2022 to 2025 (Neal Mohan, The Future of YouTube 2026).
- YouTube ads is only Alphabet’s fourth-largest revenue line. It trails Google Search and other at $63.1 billion, Google Cloud at $17.7 billion and subscriptions at $13.6 billion (Alphabet Q4 2025 results).
YouTube User and Audience Statistics
The most repeated number about YouTube is the one nobody can source. Alphabet has not published a current monthly-active-user count for YouTube. Advertising reach estimates should not be presented as user counts.
How Many People Use YouTube
Use the advertising reach figure and say the words “advertising reach” out loud. The same ad planner is where the audience demographics come from.
- YouTube’s advertising audience reached 2.53 billion people in January 2025, up 39.7 million or 1.6% in a year, and that reach covers 45.5% of the world’s internet users (DataReportal, Essential YouTube Stats, 2025).
- India is the largest single country audience with ad-planner reach approaching 500 million people, the average age band is 35 to 44, and men aged 25 to 34 are the largest single segment (DataReportal, 2025).
- The last user count YouTube published on its own press page was “over 2 billion logged-in users every month”, which this site cited in 2021; that page now says “billions of monthly logged-in users” and adds that YouTube runs localized versions in more than 100 countries across 80 languages.
- YouTube’s Android app takes more time than any other social app, more than the TikTok and Instagram Android apps combined, on Sensor Tower data covering Android only (DataReportal, Digital 2025).
If you need a defensible audience number in 2026, quote the ad-reach figure and label it. If you need a user number, the honest answer is that Google hasn’t given one.
U.S. Adult YouTube Usage Statistics
YouTube is the only platform that reaches more than eight in ten American adults, and the gap to second place is wide.
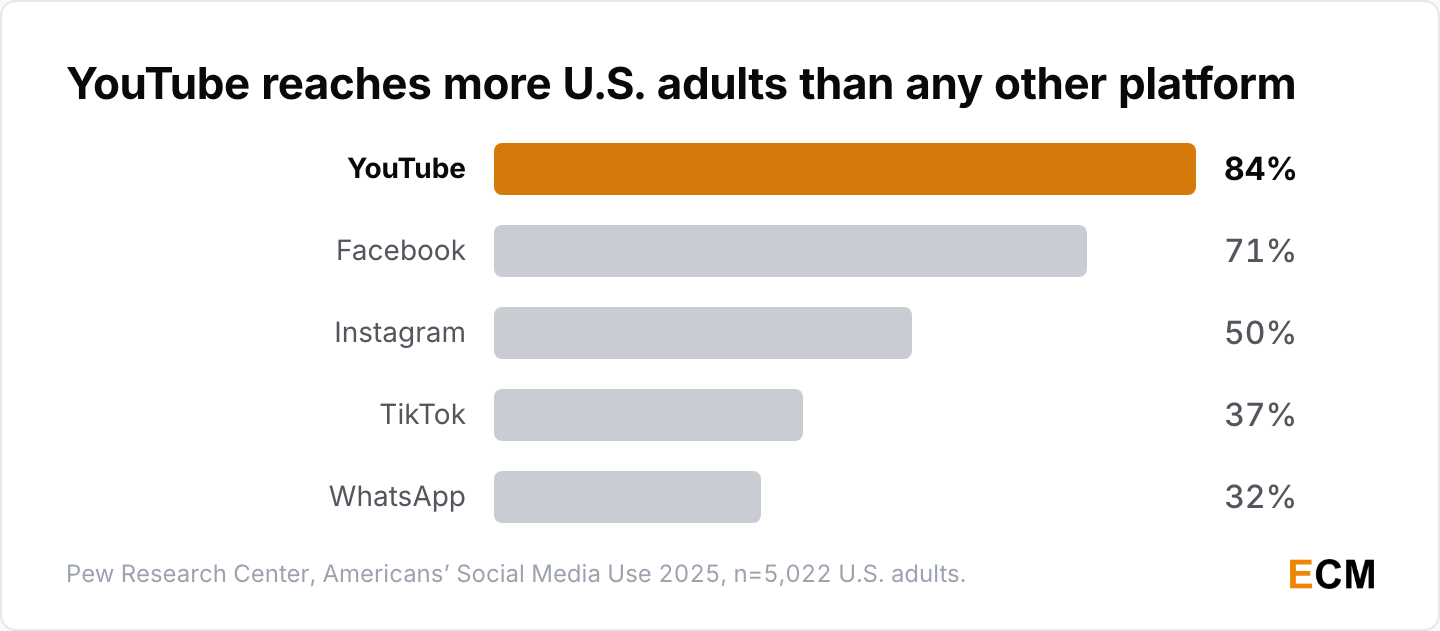
- 84% of U.S. adults say they have used YouTube, ahead of Facebook at 71%, Instagram at 50%, TikTok at 37% and WhatsApp at 32% (Pew Research Center, Americans’ Social Media Use 2025).
- Those top three are the only platforms reaching half or more of U.S. adults, and daily use skews young: adults aged 18 to 29 are the likeliest to open YouTube every day (Pew Research Center, 2025).
U.S. Teen YouTube Usage Statistics
Teens are where YouTube’s grip is tightest and where the only real softness in the data shows up.
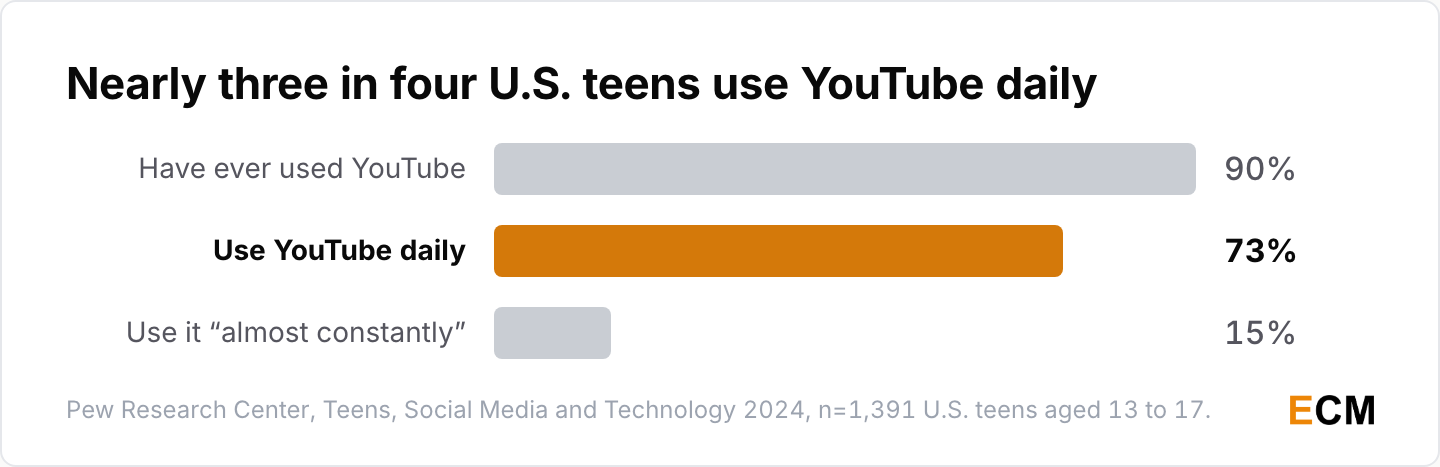
- 90% of U.S. teens aged 13 to 17 use YouTube and 73% use it daily, both the highest of any platform in that age group, against 95% who used it in 2022 (Pew Research Center, Teens, Social Media and Technology 2024).
- 15% of U.S. teens describe their YouTube use as “almost constant”, and teen boys outpace teen girls on that measure, 19% to 11% (Pew Research Center, 2024).
That teen decline is real and it’s small. I would not build a YouTube strategy on it in either direction.
YouTube Watch Time and TV Viewing Statistics
YouTube stopped being a website and became a television network, measured by the company that measures television networks.
YouTube’s Share of U.S. TV Viewing
Nielsen has put YouTube first among media companies in nearly every month since February 2025, and the line is still climbing.
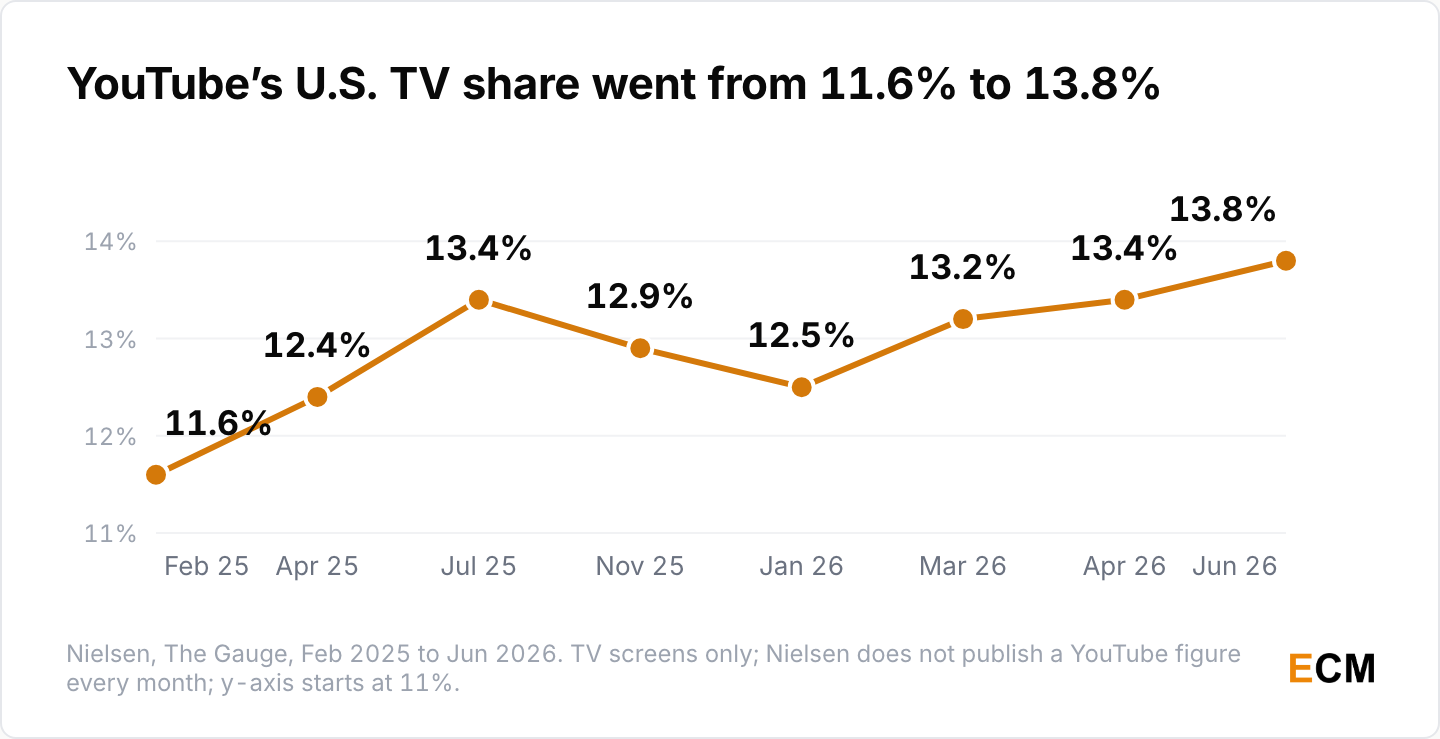
- YouTube’s share of U.S. television viewing ran 11.6% in February 2025, 12.4% in April, 13.4% in July and 12.9% in November (Nielsen, The Gauge).
- It then ran 12.5% in January 2026, 13.2% in March, 13.4% in April and a platform best 13.8% in May and June 2026. Nielsen doesn’t print a YouTube figure every month, so those are the ones it published.
- The one break in the run came in February 2026, when the Super Bowl and the Winter Olympics put NBCUniversal-Versant first at 13.1%; YouTube took the top spot back in March and has been the number one U.S. streamer for close to three years on Nielsen data (Alphabet Q4 2025 earnings call).
YouTube Versus Other TV Distributors
The gap between YouTube and the next media company is the part most decks get wrong, and it’s bigger than the share number suggests.
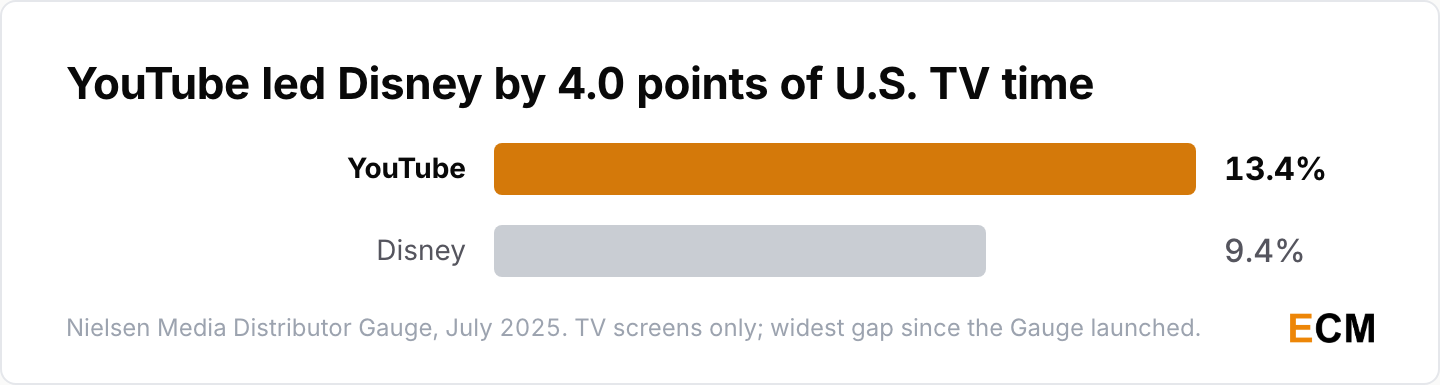
- In July 2025 YouTube held 13.4% against second-place Disney’s 9.4%, a 4.0 point gap and the widest any media company had held since Nielsen launched the Media Distributor Gauge in November 2023 (Nielsen).
- Time spent watching YouTube on television was already up 53% against February 2023, when YouTube’s share was 7.9% (Nielsen), and viewers globally now watch more than 1 billion hours of YouTube on TV screens every day (Neal Mohan, 2024 letter).
- Streaming as a whole took 48.5% of U.S. TV time in June 2026 (Nielsen), having first outgrown broadcast and cable combined at 44.8% in May 2025 (Nielsen), and the number of top creators taking most of their watch time on the big screen grew more than 400% in the three years to early 2024 (Neal Mohan).
Nielsen’s number is narrower than it looks. The Gauge measures television screens only, so every minute of YouTube watched on a phone, a laptop or a tablet is invisible to it. Viewing through the YouTube TV app is credited to the linear networks it carries. It’s a share of one screen, not of video.
YouTube for News, Podcasts and Uploads
News and podcasts are where the living-room lead turns into a content category, and our podcast statistics page tracks the wider shift.
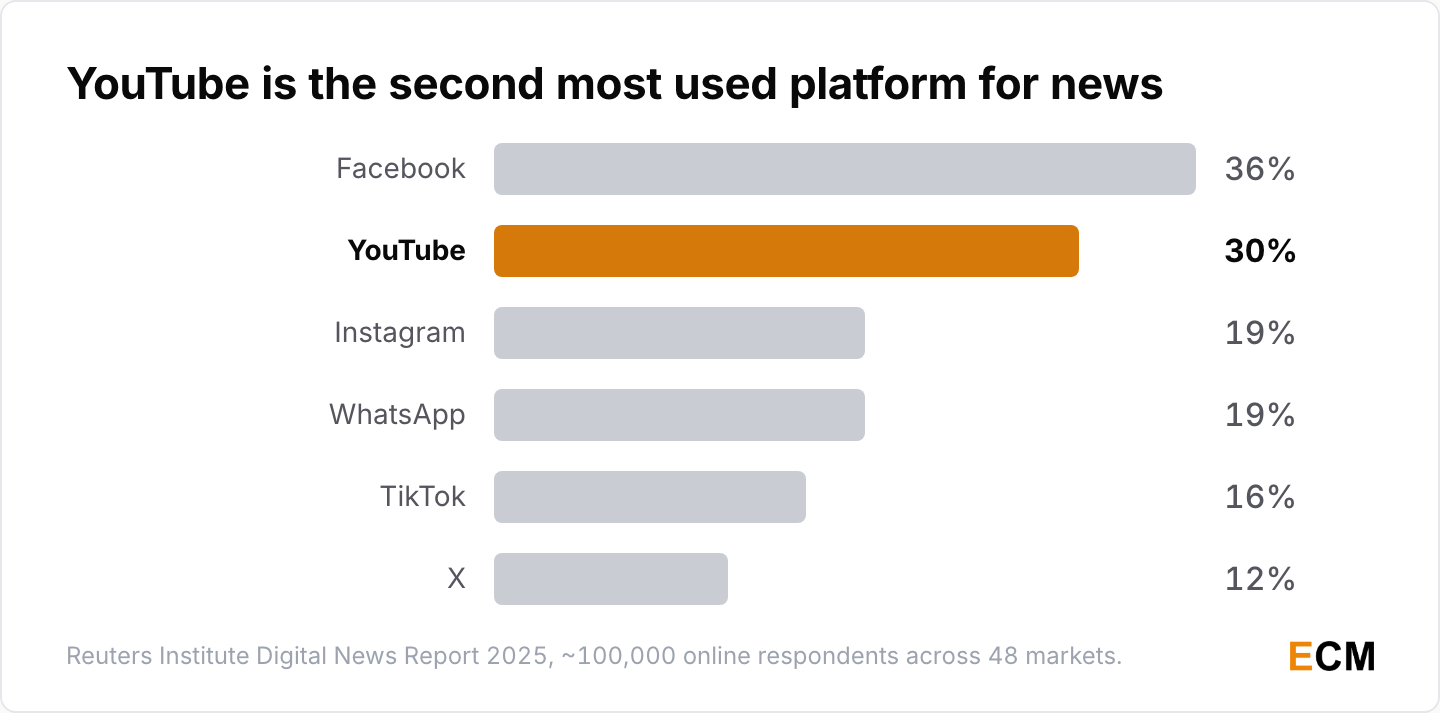
- 30% of online news users used YouTube for news in the past week, second only to Facebook at 36% and ahead of Instagram and WhatsApp at 19%, TikTok at 16% and X at 12% (Reuters Institute Digital News Report 2025).
- Social video use for news rose from 52% of people surveyed in 2020 to 65% in 2025, and 44% of 18 to 24 year olds now name social media as their main source of news (Reuters Institute, 2025).
- Viewers watched more than 700 million hours of podcasts on living-room devices in October 2025, up 75% year over year (Alphabet Q4 2025 earnings call), and more than 20 million videos now go up on an average day (YouTube press page, 2026).
Half the YouTube articles on the internet still quote more than 500 hours of video a minute as though it were measured yesterday. YouTube last stated that in February 2023 and has not revised it. Quote it with the date attached, or use the daily upload count instead. Our video marketing statistics page carries the cross-platform version of the same question.
YouTube Shorts Views and Monetization Statistics
Shorts is where the numbers move fastest and where the measurement is least stable.
Shorts Daily Views and the Counting Change
Read the counting note before you put any Shorts growth rate in a deck. The rule changed between the two announcements everybody compares.
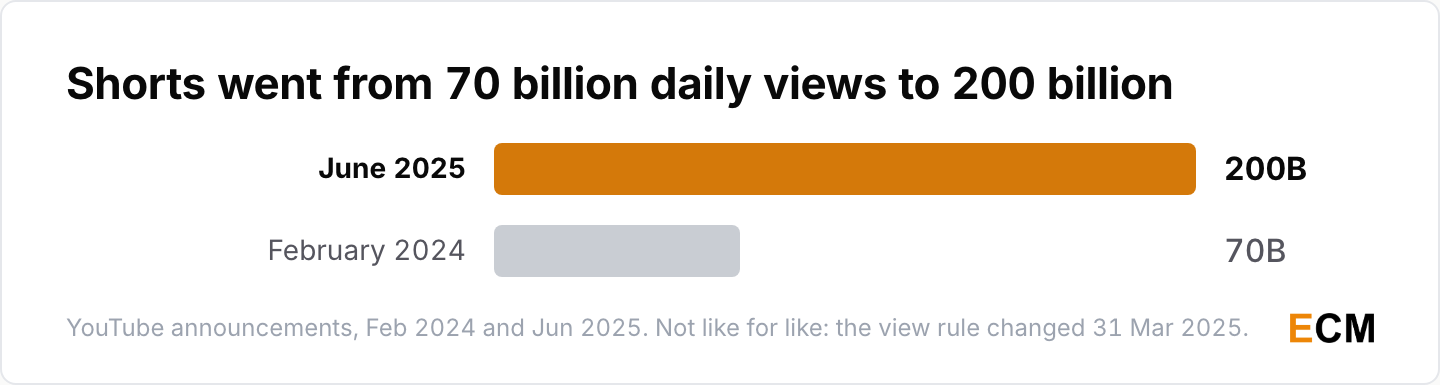
- YouTube Shorts averages more than 200 billion views a day, announced on 18 June 2025 (YouTube, Cannes 2025).
- The comparable figure announced in February 2024 was 70 billion daily views (Neal Mohan, 2024 letter).
- From 31 March 2025 a Shorts view counts every time the video starts to play or replay with no minimum watch time, the old metric was renamed “Engaged views” in YouTube Analytics, and a Short can run up to 3 minutes (YouTube Help).
The newer daily-view figure sits under the new rule and the earlier figure under the old one. The growth between them isn’t a like-for-like comparison, and anyone presenting it as one is overstating the move.
Shorts Advertising Spend by Format
A fifth of YouTube video ad spend is now short-form, which is the fastest format shift I have seen on the platform.
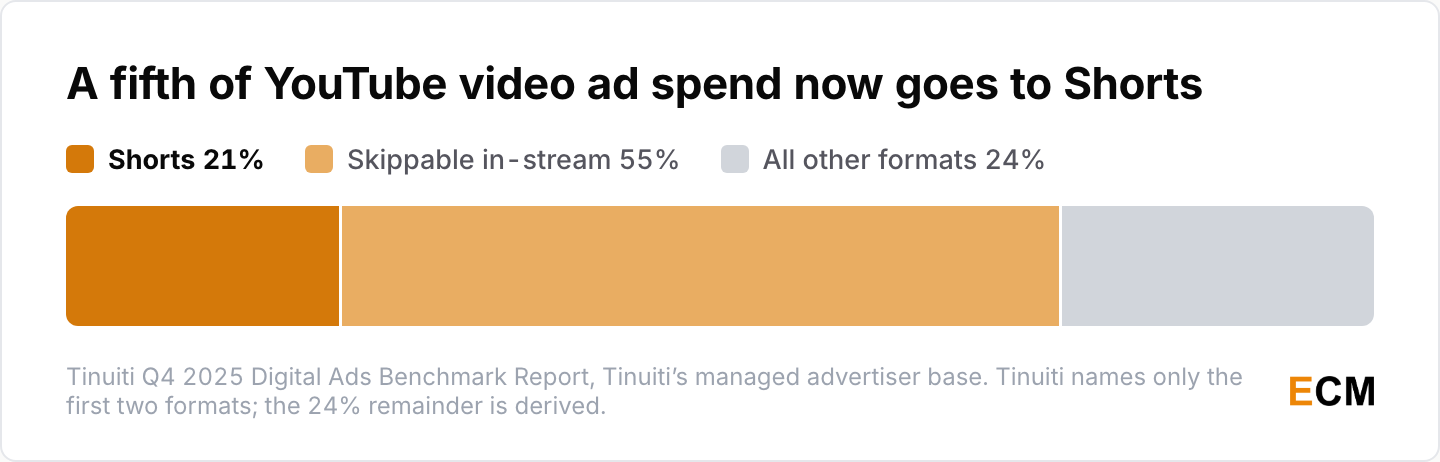
- Shorts took roughly 21% of spend on traditional YouTube video campaigns in the fourth quarter of 2025, against 55% for skippable in-stream (Tinuiti Q4 2025 Digital Ads Benchmark Report).
- Shorts now earns more revenue per watch hour than traditional in-stream YouTube in several countries including the United States, first said on the Q3 2025 call and repeated a quarter later (Alphabet Q4 2025 earnings call).
That per-hour claim should change how you plan, and it is narrower than it reads. It’s Alphabet’s revenue per watch hour, not a creator’s payout, so it doesn’t mean Shorts earns your channel more per hour. It means the platform no longer has a revenue reason to push everyone toward long-form. Our guide to promoting a YouTube channel covers the sequencing.
Where Shorts Ad Money Lands
Half of Shorts ad spend runs on a television, which is the detail that undoes the “Shorts equals mobile” assumption.
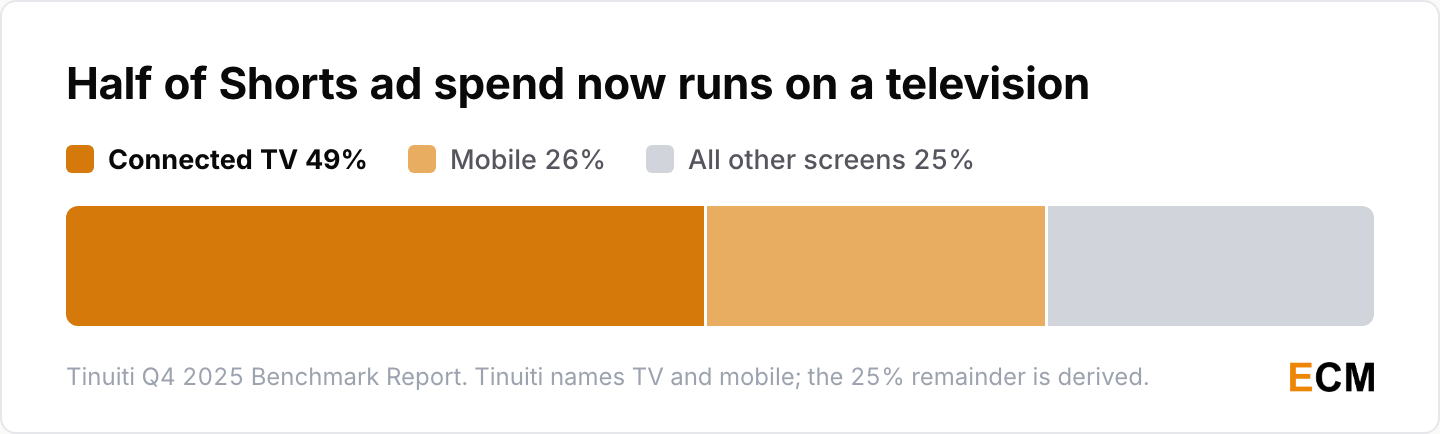
- 49% of Shorts ad spend went to television screens and 26% to mobile in the fourth quarter of 2025 (Tinuiti, 2026).
YouTube Revenue and Advertising Statistics
Alphabet doesn’t report YouTube as a segment. What exists is one advertising line and one combined figure the CEO gives once a year on the earnings call.
YouTube Advertising Revenue by Quarter
The quarterly ad line is the only YouTube revenue number Alphabet publishes on a schedule, and it is the one I would build a forecast on.
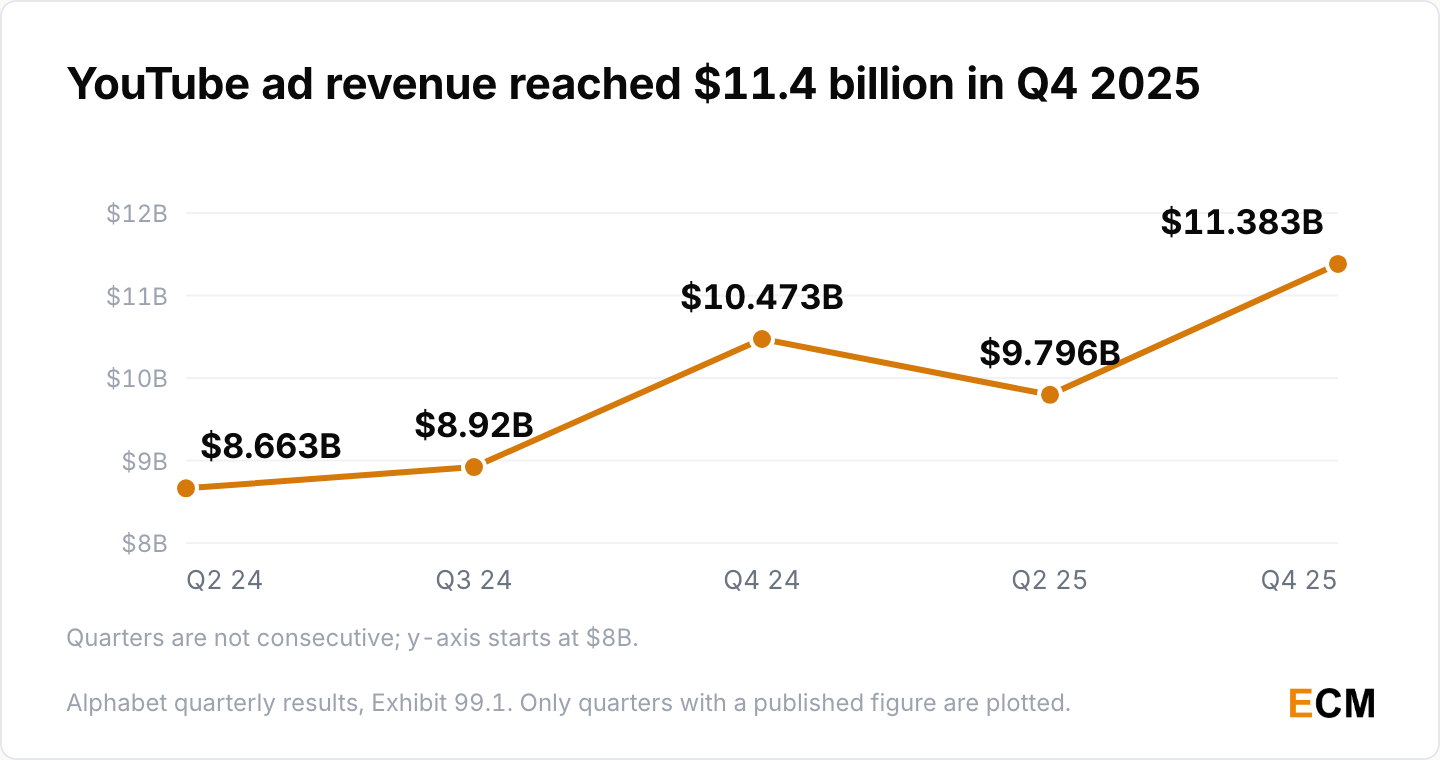
- YouTube advertising revenue was $11.4 billion in the fourth quarter of 2025, up 9% year over year (Alphabet Q4 2025 results, Exhibit 99.1) held down by lapping the 2024 U.S. election advertising cycle (Alphabet Q4 2025 earnings call).
- It was $9.796 billion in the second quarter of 2025 against $8.663 billion in the second quarter of 2024 (Alphabet Q2 2025 results), and $8.92 billion in the third quarter of 2024 (Alphabet Q3 2024 results).
- Revenue across advertising and subscriptions passed $60 billion for the full year 2025 (Alphabet Q4 2025 earnings call).
How YouTube Ads Compare to Alphabet Revenue
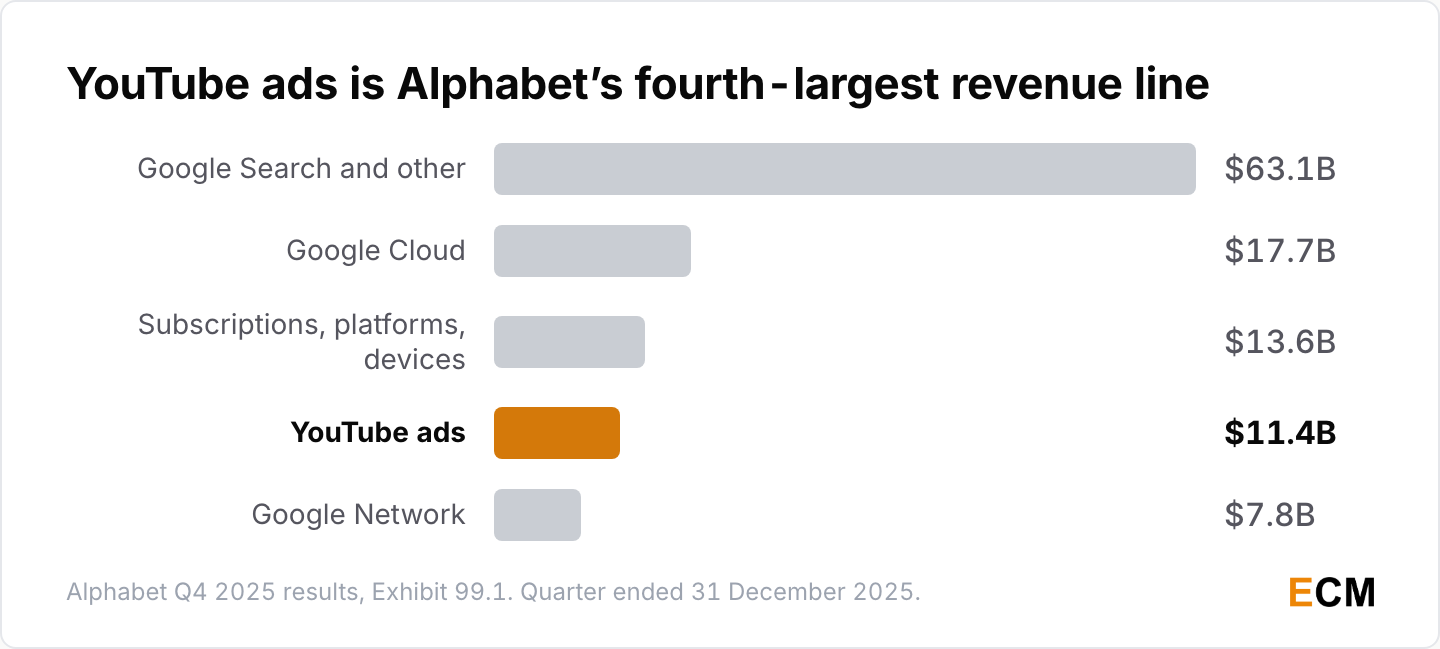
YouTube advertising is Alphabet’s fourth-largest revenue line, which is a useful corrective to how the platform gets talked about in strategy decks.
- Alphabet’s total revenue was $113.8 billion in the fourth quarter of 2025, up 18%, and $402.8 billion for the full year (Alphabet Q4 2025 results, Exhibit 99.1).
- Inside that quarter, Google Search and other brought $63.1 billion, Google Cloud $17.7 billion, subscriptions, platforms and devices $13.6 billion, YouTube ads $11.4 billion and Google Network $7.8 billion (Alphabet Q4 2025 results).
- Google advertising as a whole was $82.3 billion for the quarter and Google Services $95.9 billion, up 14% (Alphabet Q4 2025 results).
YouTube Premium and TV Subscribers
The subscription side is real money with uneven disclosure: fresh for Music and Premium, stale for YouTube TV.
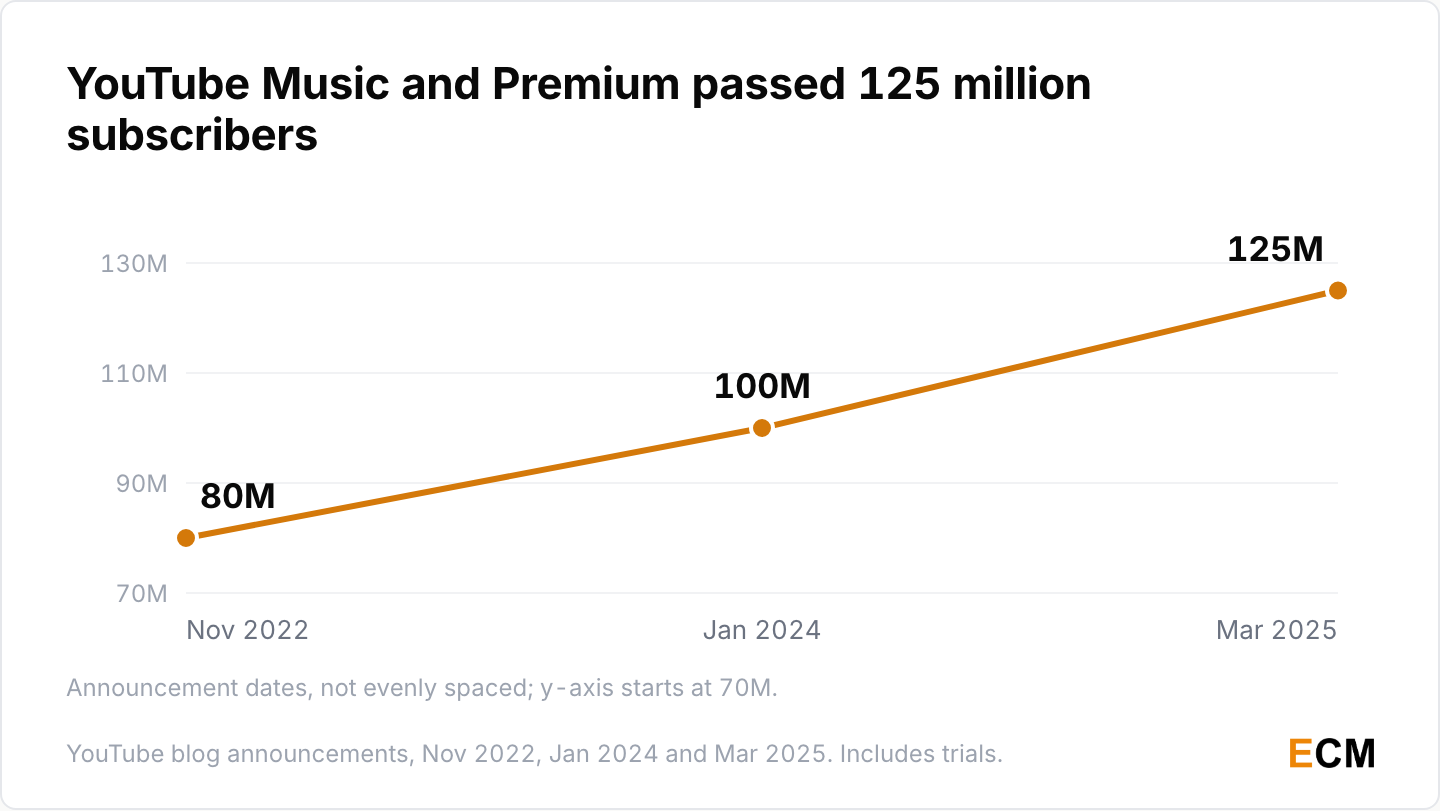
- YouTube Music and Premium reached 125 million subscribers globally including trials as of March 2025 (Lyor Cohen, YouTube), up from 100 million in January 2024 and 80 million in November 2022.
- Subscriptions, platforms and devices revenue was $13.6 billion in the fourth quarter of 2025, up 17%, a line that bundles YouTube Music, Premium, YouTube TV and NFL Sunday Ticket with Google One (Alphabet Q4 2025 results).
- Alphabet has more than 325 million paid subscriptions across its consumer services, led by YouTube Premium and Google One (Alphabet Q4 2025 earnings call), while YouTube TV’s last formally disclosed figure was more than 8 million in February 2024 (Neal Mohan, 2024 letter).
Anything more current you see quoted for YouTube TV is an analyst’s estimate. The Music and Premium number is thirteen months fresher and comes straight from YouTube’s own blog.
Demand Gen and YouTube Ad Formats
If you buy YouTube through Google Ads, the product you are buying has changed underneath you.
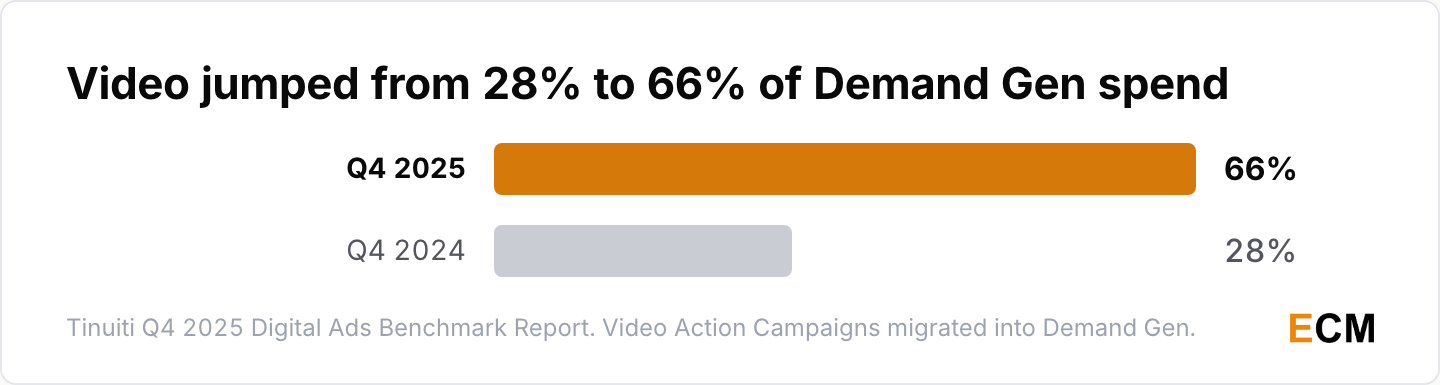
- Video accounted for 66% of Demand Gen spend in the fourth quarter of 2025, up from 28% a year earlier, while Demand Gen spend overall grew 25% year over year with impressions up 40% (Tinuiti Q4 2025 Digital Ads Benchmark Report).
- Demand Gen CPMs fell 11% year over year in the same quarter (Tinuiti, 2026).
- Google stopped new Video Action Campaigns in April 2025, began auto-upgrading existing ones in July 2025 and set April 2026 for the final migrations, and says advertisers running Demand Gen with video and image assets saw 20% more conversions at the same cost per action than video-only campaigns (Google Ads Help).
The Tinuiti figures come from its managed advertiser base, which skews toward mid-size and large performance advertisers in retail and e-commerce. Tinuiti measures traditional YouTube video campaigns, and Demand Gen inventory is counted separately. If you run brand campaigns or a small budget, those benchmarks are not your benchmarks.
YouTube Creator and Channel Statistics
Almost every creator economy number comes from YouTube or from research YouTube paid for. The definitions get chosen by the company that benefits from the answer, so they are stated here alongside the figures.
Top YouTube Channels by Subscribers
Channel pages publish their own subscriber counts, and that is the only place I would take a list of top YouTube creators from.
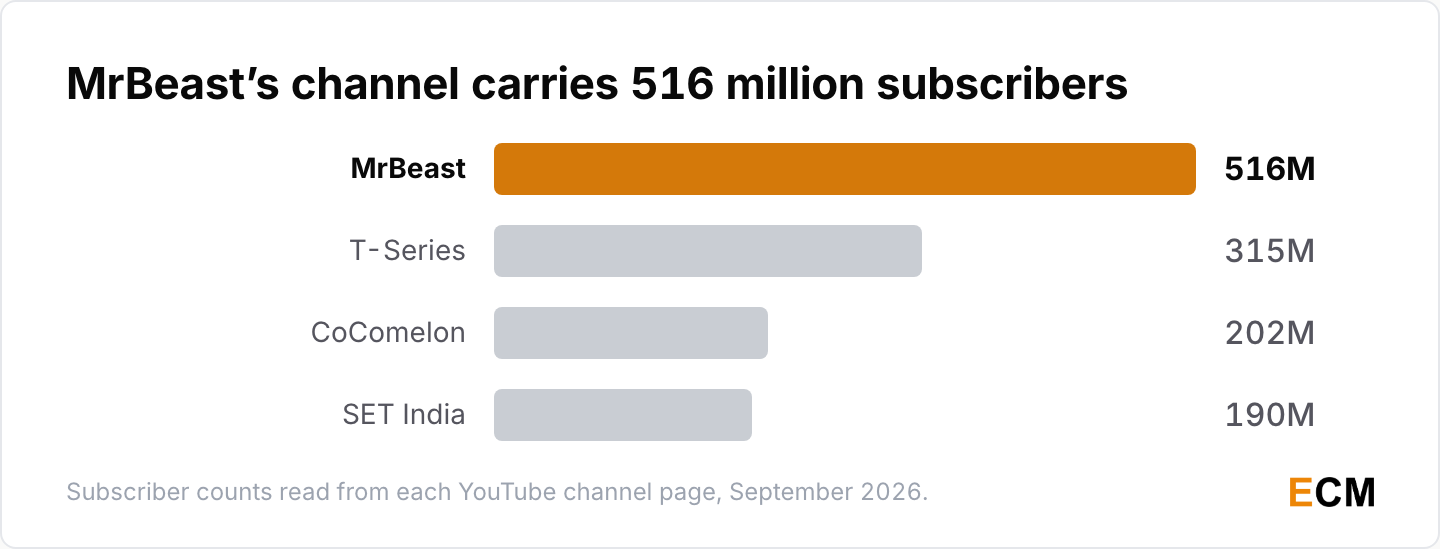
- MrBeast’s channel carries 516 million subscribers (MrBeast on YouTube, September 2026).
- T-Series carries 315 million subscribers, CoComelon 202 million and SET India 190 million (T-Series, CoComelon and SET India on YouTube, September 2026).
- “Baby Shark Dance” has passed 17.3 billion views since it went up in June 2016 (Pinkfong on YouTube, September 2026).
Only one of those four is an individual creator. Two are Indian media companies and one makes videos for toddlers, which is worth remembering before anyone quotes a subscriber ranking as evidence of what adults watch.
Creator Payouts and Revenue Share
The split is the fact. Everything expressed as revenue per thousand views is somebody’s estimate, which is why our YouTube monetization guide works from the split instead.
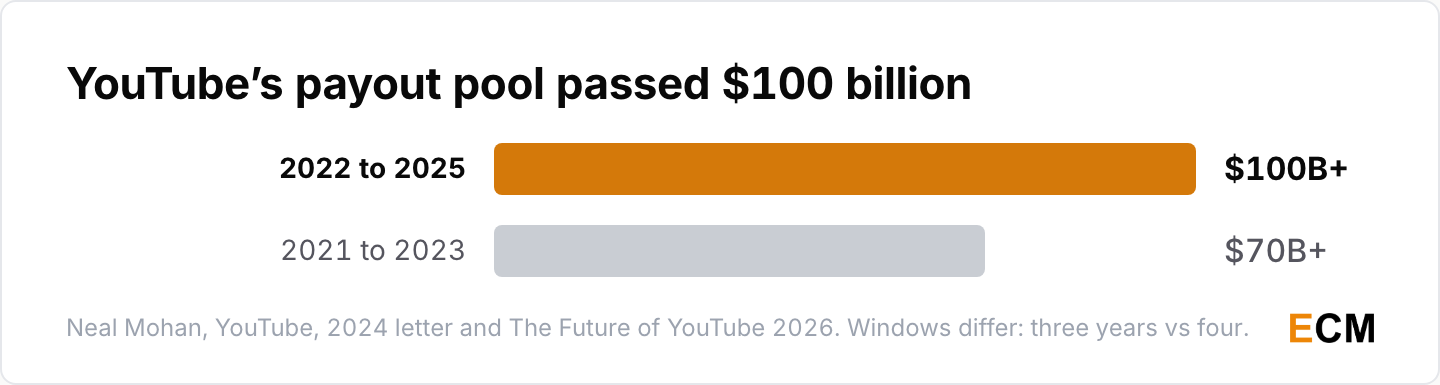
- YouTube paid more than $100 billion to creators, artists and media companies over the four years from 2022 to 2025 (Neal Mohan, The Future of YouTube 2026), against more than $70 billion over the three years from 2021 to 2023 (Neal Mohan, 2024 letter).
- Creators keep 55% of net Watch Page advertising revenue on long-form video and 45% of their allocated share of a pooled Shorts revenue fund, which isn’t the same as 45% of the ads on their own Shorts (YouTube Partner Program earnings).
- A channel needs 1,000 subscribers plus either 4,000 qualified public watch hours in 12 months or 10 million qualified Shorts views in 90 days to join the Partner Program (YouTube Help).
- The Partner Program passed 3 million channels by February 2024 (Neal Mohan, 2024 letter), and YouTube paid more than $6 billion to the music industry in the 12 months to June 2022 (YouTube).
YouTube publishes the split. It doesn’t publish revenue per thousand views, and if you want a route into the Partner Program, our guide to making money on YouTube starts from those thresholds.
YouTube’s Economic Impact and Jobs
I still use these numbers. I just say “Oxford Economics, commissioned by YouTube” out loud, the way you would with any sponsored research.
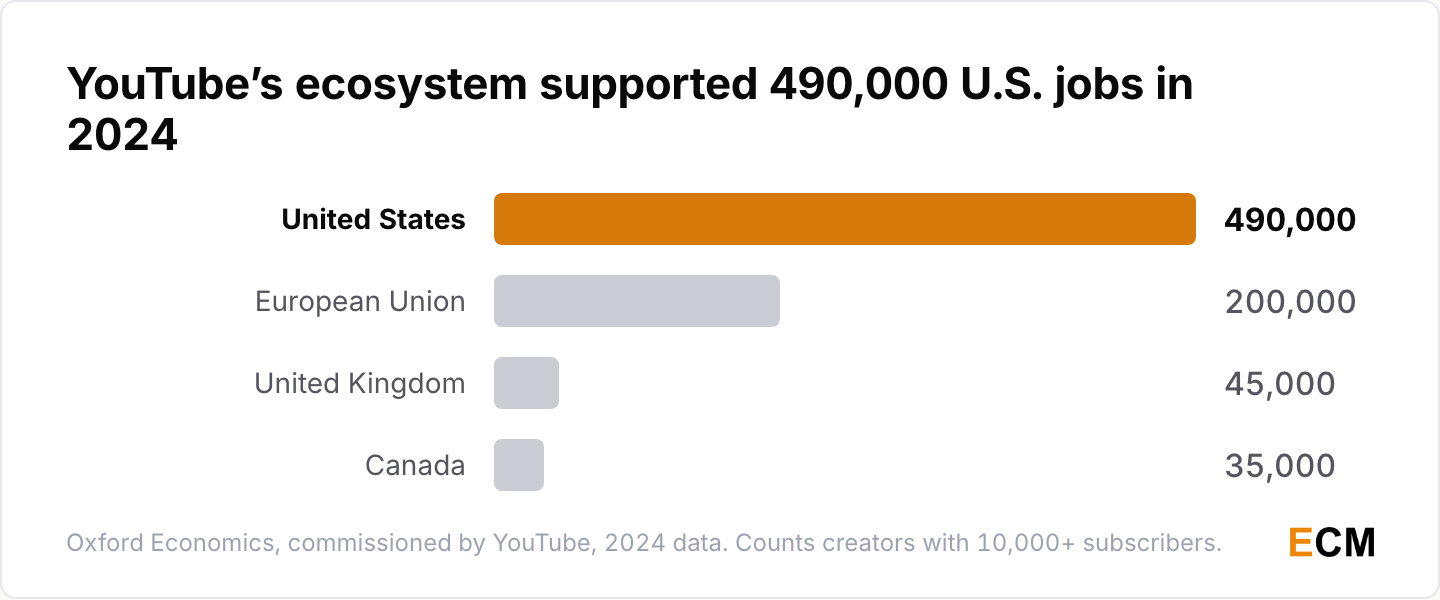
- YouTube’s creative ecosystem contributed $55 billion to U.S. GDP in 2024 and supported the equivalent of 490,000 full-time U.S. jobs (YouTube, 2024 U.S. Impact Report, research by Oxford Economics, 2025).
- The same model put the 2024 contribution at more than €7 billion and more than 200,000 full-time-equivalent jobs across the European Union, and £2.2 billion and more than 45,000 jobs in the United Kingdom.
- Canada’s 2024 figures were CA$1.8 billion and more than 35,000 jobs (Google, 2025), and the model counts a “creative entrepreneur” as someone with 10,000 or more subscribers on their largest channel, or a smaller creator who earns money from YouTube or permanently employs others (Oxford Economics, 2025).
The model includes smaller channels when they earn money from YouTube or permanently employ others. Its payout total was supplied by YouTube. Our influencer marketing statistics page has the same problem across a wider set of vendors, and the same fix.
How to Track Your YouTube Channel Stats
Everything above is about the platform. The YouTube stats for your own channel live in YouTube Studio, and those are the ones that should drive what you make next.
- YouTube Analytics splits channel and video performance across 7 tabs, Overview, Content, Reach, Engagement, Audience, Revenue and Trends, with Advanced Mode for deeper cuts and data exports (YouTube Help, Get started with YouTube Analytics, 2026).
- Channel reports open from Analytics in the Studio menu and video reports open from Content, with some reports unavailable on mobile, some data limited by geography, traffic source or gender, and an updated Analytics layout rolling out since July 2026 (YouTube Help, 2026).
The tabs I would live in are Reach, for impressions and click-through rate, and Audience, for what else your viewers watch. Both point at what to make next rather than at what already happened.
YouTube AI Tools and Labeling Statistics
YouTube shipped generative AI into the creation flow and started reporting adoption in 2026. These are the first numbers the company has put behind it.
- More than 1 million channels used YouTube’s AI creation tools on an average day in December 2025, and more than 20 million viewers used the Gemini-powered “Ask” tool that month (Alphabet Q4 2025 earnings call, February 2026).
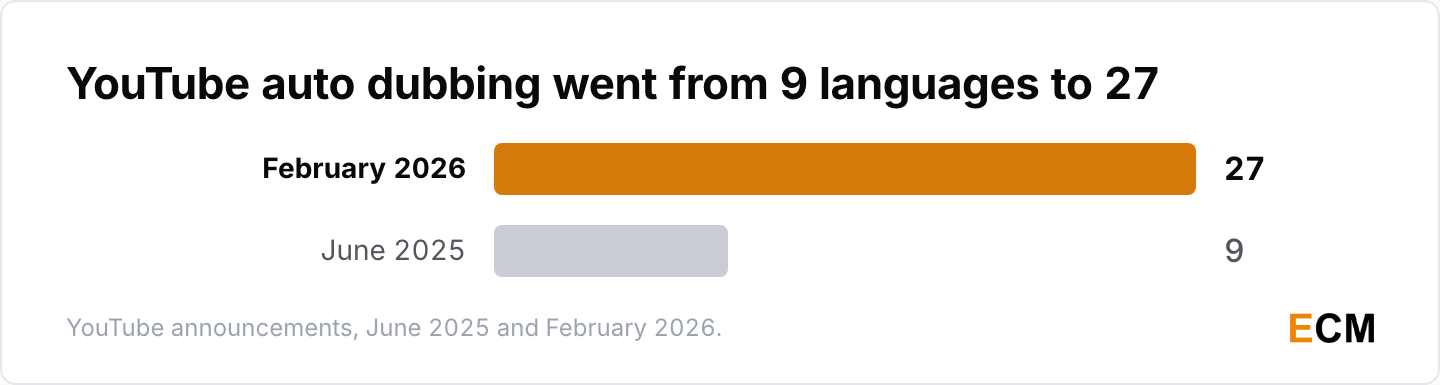
- Auto dubbing reached 27 languages by February 2026, up from nine in June 2025, after dubbing more than 20 million videos in its first six months (Neal Mohan, Cannes 2025).
- Veo 3 Fast, a custom version of Google DeepMind’s Veo 3, launched inside Shorts on 16 September 2025 in the United States, United Kingdom, Canada, Australia and New Zealand, generating 480p clips with sound from text prompts (YouTube, Made On YouTube 2025).
- A Creator Studio disclosure tool has required creators to label realistic altered or synthetic media since 18 March 2024, with the label showing on the player itself for sensitive topics including elections, health and finance (YouTube).
- The altered-content label arrives 4 ways: creator disclosure in Studio, YouTube applying it proactively, use of YouTube’s own generative tools, or valid C2PA Content Credentials on the file (Google Support).
- Disclosure is not required for clearly unrealistic or animated content, for productivity uses such as script generation and captions, or for inconsequential changes such as colour correction and beauty filters (YouTube, 2024). Individuals can separately request removal of AI-generated content mimicking their likeness or voice under YouTube’s privacy guidelines rather than its Community Guidelines.
Neal Mohan’s 2026 priorities name fighting AI “slop” alongside expanding AI creation tools, which is a harder position to hold than it reads. YouTube now ships both the tools that make it and the labels that flag it, and it has put no enforcement volumes behind either.
Frequently Asked Questions
How Can I See YouTube Stats for a Channel?
The YouTube stats for a channel you own live in YouTube Studio under Analytics, split across 7 tabs including Overview, Revenue and Trends, with Advanced Mode for comparisons and exports (YouTube Help, 2026).
For channels you do not own, the public numbers are the subscriber and view counts on the channel page itself, such as the 516 million on MrBeast’s channel in September 2026. Platform-level figures like reach and TV watch time come from Alphabet’s filings and from Nielsen, not from Studio.
Is YouTube Growing or Declining?
Growing, on every measure Alphabet actually discloses. Advertising revenue rose 9% year over year to $11.4 billion in the fourth quarter of 2025 and full-year revenue across ads and subscriptions passed $60 billion (Alphabet Q4 2025 results).
Its share of U.S. television viewing went from 11.6% in February 2025 to 13.8% in June 2026 (Nielsen). The one soft spot is U.S. teen adoption, 90% in 2024 against 95% in 2022 (Pew Research Center).
How Much Money Does 1,000 Views Get on YouTube?
YouTube doesn’t publish a rate. What it publishes is the split: creators keep 55% of net Watch Page advertising revenue under the Partner Program, and 45% of their allocated share of the pooled Shorts revenue fund (YouTube Partner Program earnings). Every per-thousand-view dollar figure you see is either an average of creator self-reports or an estimate, and the real number varies enormously by niche, country and format.
How Many Views Do You Need to Make $2,000 a Month?
There is no published rate to work from, so any single view count answering this is invented. YouTube publishes the revenue share, 55% of net Watch Page advertising revenue and 45% of an allocated Shorts pool (YouTube Help), and the Partner Program thresholds of 1,000 subscribers plus either 4,000 qualified watch hours in 12 months or 10 million Shorts views in 90 days (YouTube Help).
It has never published a revenue-per-thousand-views figure.
What Are the Top YouTube Channels by Subscribers?
MrBeast’s channel carries 516 million subscribers, T-Series 315 million, CoComelon 202 million and SET India 190 million, all read from the channel pages in September 2026 (MrBeast, T-Series, CoComelon, SET India). On single videos, “Baby Shark Dance” has passed 17.3 billion views since June 2016 (Pinkfong on YouTube).
What Share of U.S. TV Viewing Does YouTube Have?
13.8% in June 2026, the largest share of any media distributor, per Nielsen’s Media Distributor Gauge. That measures television screens only. Phone, tablet and desktop viewing does not count toward it, and viewing through the YouTube TV app is credited to the linear networks it carries rather than to YouTube. Read it as a share of television, not as a share of all video.
How Big Is YouTube Shorts?
More than 200 billion views per day as of June 2025 (YouTube, Cannes 2025). The comparison to 70 billion daily views in February 2024 is not clean, because the view-counting rule changed on 31 March 2025 (YouTube Help). On the money side, Shorts took about 21% of YouTube video ad spend in the fourth quarter of 2025, and 49% of that spend ran on television screens (Tinuiti).
How Does YouTube Ad Revenue Compare to Alphabet’s?
YouTube advertising was $11.4 billion in the fourth quarter of 2025 against Alphabet’s $113.8 billion total, which makes it the fourth-largest line Alphabet reports, behind Google Search and other at $63.1 billion, Google Cloud at $17.7 billion and subscriptions, platforms and devices at $13.6 billion (Alphabet Q4 2025 results, Exhibit 99.1).
Written by
Editorial Staff
The Editorial Staff represents the writers, editors, and content creators who have worked (or work) at Elite Content Marketer. The experimenter-in-chief behind the team is Chintan Zalani, who has close to a decade of experience trying to make sense of the content marketing industry. Started in 2019, Elite Content Marketer is on a mission to help creators build sustainable businesses.
Related Articles
Marketing Data
57 AI Translation Statistics for 2026: 1B Monthly Users
57 AI translation statistics for 2026: 1B monthly Google translation users, a $72.6B language industry, and impactful AI errors in 92% of Somali sections.
Sep 13, 2026Read more →

Marketing Data
58 B2B Content Marketing Statistics for 2026: 95% Use AI
58 B2B content marketing statistics for 2026: 95% of B2B marketers say their organization uses AI, and 61% say their content strategy improved.
Sep 13, 2026Read more →

Marketing Data
60 B2B Buyer Statistics for 2026: 94% Use AI
60 B2B buyer statistics for 2026: 94% of buyers use LLMs, first contact comes 61% into the journey, and 13 people join the average decision.
Sep 12, 2026Read more →