A couple of decades ago, Salesforce emerged as a little company. It took on giants in the customer relationship management (CRM) market. Little did we know, that it’s soon going to usher in an era of relentless Software as a Service (SaaS) growth.
In 2019, the annual run rate of the company exceeded $14 billion. It has become the most successful cloud application ever. In this article, you’ll see a few stats that show the health of the industry and where it’s headed. Let’s get started!
SaaS Revenue Statistics
1. Synergy Research found that the enterprise SaaS revenue passed $100 billion run rate in the first quarter of 2019. Further, the market continues to grow at about 30% per annum.
2. Microsoft continues to lead the enterprise SaaS market and it continues to enhance its overall market leadership.

3. In 2018, the average company spent $343,000 on SaaS. It’s an increase of 78% from last year.
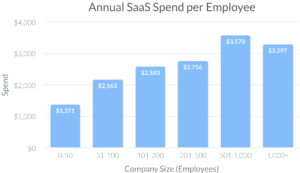
4. The average employee uses at least 8 apps, and the company spends an average of $2,884 in SaaS subscriptions on them. Depending on the company size, here’s how the average SaaS spend varies.
5. KeyBanc’s SaaS Survey found a 73% overall gross margin (2018 data). Here’s how it compares with other benchmarks.

SaaS Growth Statistics
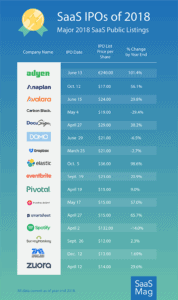
1. With 16 major high-growth software players going public, 2018 is touted as the year SaaS went public.
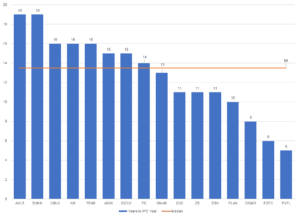
2. While the scale of these companies varies widely, it took a median of 14 years for these companies to go from founding to their IPO year.
3. Gartner surveys found that more than a third of organizations see cloud investments as one of their top three investment priorities.
4. Gartner projected the cloud services industry to grow exponentially through 2022, with SaaS revenue touching $143.7 billion. In 2019, the revenue forecast stands at $94.8 billion.
5. As of May 2018, there were over 34,727 software products across vertical industries listed on G2 Crowd. It shows that the SaaS industry is getting more cluttered and saturated by the day.
6. In 2017, SaaS companies reported facing over 9 competitors on average in their first year. It’s a steep increase from 2013 (when the average competition was about 2.6).
SaaS Marketing And Sales Statistics
1. In its 2018 expansion SaaS Benchmarks report, Openview found that free trials are the most popular product-led growth strategy.
2. The IT budget is now distributed across the entire organization, with the average mid-sized company having as many as 32 different billing owners for its SaaS applications. Goes to show how SaaS is decentralized across the organization.
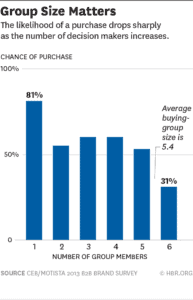
3. A survey of 5,000 stakeholders involved in B2B purchases, found that, on average, 5.4 people now sign off on each purchase.
4. In an analysis of 500 SaaS companies, the top 10% of SaaS blogs were found to receive 104,000 organic search visits/month.
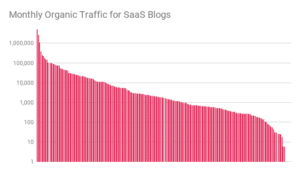
Content marketing hence seems to be a viable investment for generating a predictable source of leads and revenue that compounds over time.
Yet 38 of the biggest 250 SaaS companies don’t have a blog.
5. The fastest-growing SaaS companies seem to take a mix of educational (which provides value and solves problems for the readers) and PR content (focusing on the company and its products).
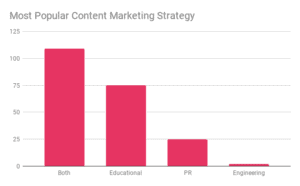
Such a content marketing strategy could mean that companies don’t have the resources to create educational content. Otherwise, they consider it important to create content related to their products and their brand.
SaaS Churn Statistics
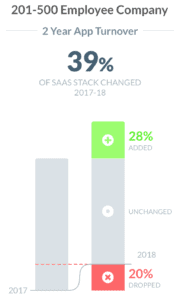
1. The tech industry has the highest turnover rate at 13.2%, but guess who has a higher turnover? It’s SaaS apps. As per Blissfully, between 2017 to 2018, the typical mid-sized company changed 39% of their SaaS software.
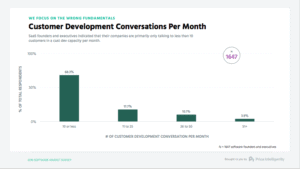
2. It’s not that difficult to understand why change is the norm in SaaS, given that most SaaS founders have fewer than ten customer development conversations per month.
SaaS Security And Privacy Statistics
1. In the wake of data breaches and regulations like GDPR at the forefront, security, and compliance have become critical for the smooth functioning of businesses. Here’s a look at how SaaS businesses are faring.
2. In a Ping Identity Survey, more than 27% of the respondents’ organizations experienced a breach of customer identity data stored in a public cloud, on-premises, or in a SaaS application provider’s cloud.
3. A surprising 71% of organizations have an orphaned SaaS subscription. It might mean that the person who originally purchased the app on behalf of the company has left the organization. These apps can cost as much as $8,520 annually per subscription (at $710 per month). However, the bigger concerns are the security and data risks of these apps.
4. The relationship between an app and a person is complex – comprising aspects like access, data sharing, usage, spending, and the like. While the typical 200 to 500-person company uses 123 apps, it would have an average of 2,700 app-to-person connections.
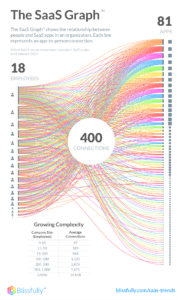
All of these connections need to be managed and kept secure as it has implications for the organization’s privacy and operations.
Final Thoughts
SaaS is ubiquitous. It’s crucial for the successful operation of modern businesses. However, as we saw in the article, the SaaS industry has its own set of challenges and unique trends.
Which of the above SaaS industry statistics did you find the most surprising? Let me know in the comments below.
