Statista projects worldwide SaaS revenue at $488.5 billion in 2026 (Statista Market Insights, Software as a Service, 2026). These SaaS statistics cover market size, spend per company, churn and retention, growth rules, AI and how buyers choose software.
SaaS Statistics 2026: 60 Facts on Spend, Churn and AI
 Written by Editorial Staff

Key Takeaways
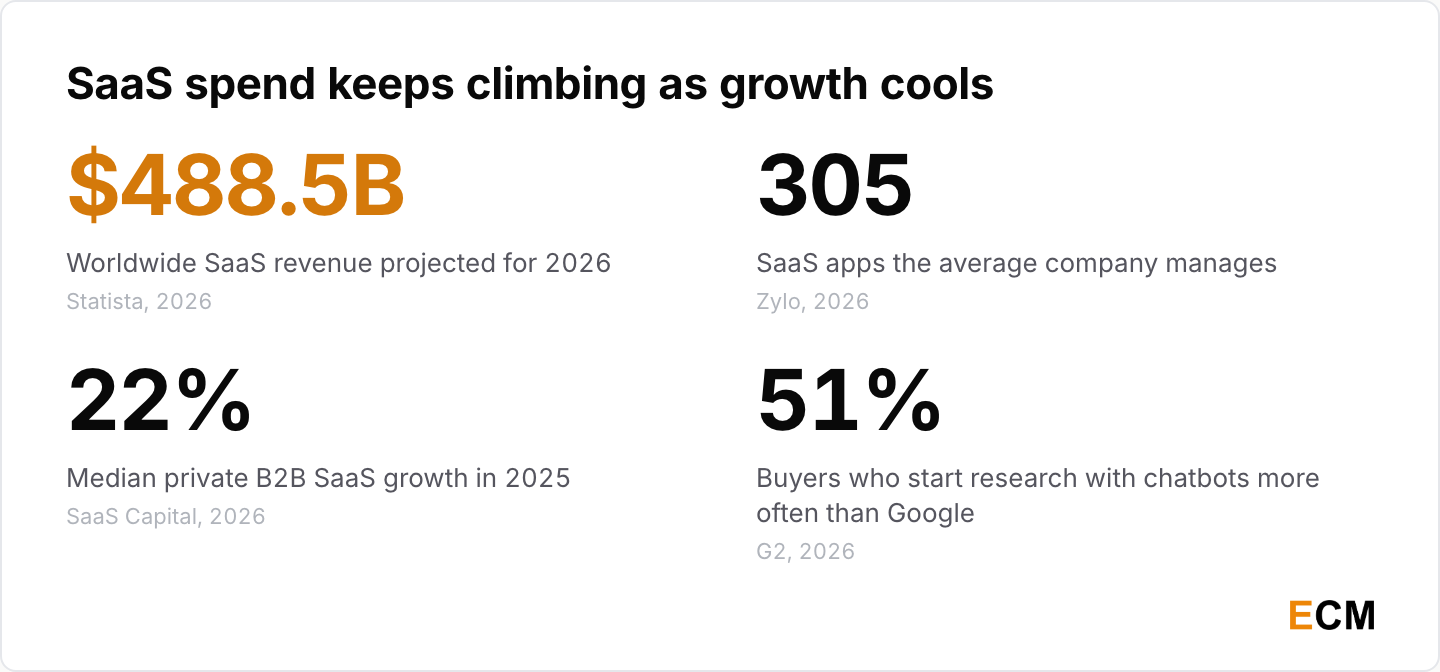
- The market keeps compounding. Statista expects SaaS revenue to grow 11.86% a year to $855.6 billion by 2031 (Statista Market Insights, 2026).
- Companies run hundreds of apps. The average organization manages 305 SaaS applications and spends $55.7 million a year on them (Zylo, SaaS statistics, 2026).
- More than a third of licenses sit idle. Organizations leave 36% of their SaaS licenses unused (Zylo, 2026 SaaS Management Index, 2026).
- Growth has cooled. Median growth for private B2B SaaS companies fell to 22% in 2025, from 25% in 2024 (SaaS Capital, growth benchmarks, 2026).
- AI-native companies grow faster. At $1 million to $5 million ARR, AI-native companies posted 110% median growth against 40% for B2B SaaS companies of the same size (High Alpha and Growth Unhinged, 2025 SaaS Benchmarks, 2025).
- Buyers start with chatbots. 51% of B2B software buyers now begin research with an AI chatbot more often than with Google (G2, The Answer Economy, 2026).
SaaS Market Size and Growth Statistics
The SaaS market is still growing in double digits, private SaaS companies are growing slower than they did a year earlier, and public SaaS valuation multiples have swung hard.
How Big Is the SaaS Market?
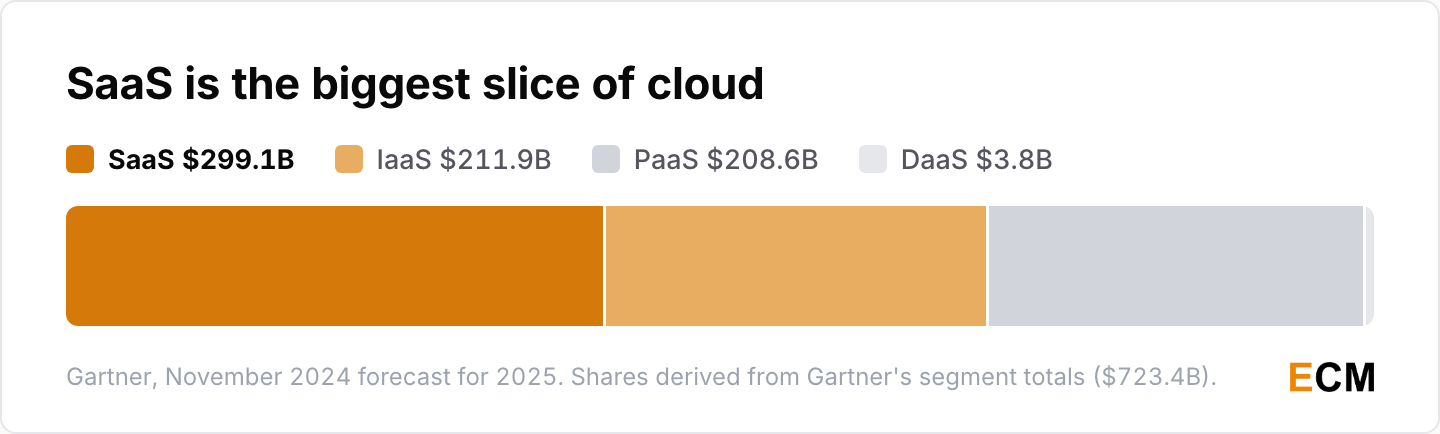
Statista and Gartner both put SaaS in the hundreds of billions. In Gartner’s 2025 forecast, SaaS took about 41.3% of public cloud spending, against 29.3% for IaaS ($211.9 billion), 28.8% for PaaS ($208.6 billion) and 0.5% for desktop-as-a-service ($3.8 billion).
- Statista projects SaaS revenue of $488.5 billion in 2026, with the United States alone at $254.9 billion (Statista Market Insights, Software as a Service, 2026).
- Gartner forecast SaaS end-user spending of $299.1 billion in 2025, up 19.2% from $250.8 billion in 2024 (Gartner, public cloud forecast, 2024). That made SaaS about 41% of Gartner’s $723.4 billion public cloud forecast for 2025, ahead of infrastructure at $211.9 billion and platform services at $208.6 billion (Gartner, public cloud forecast, 2024).
- Synergy expected enterprise SaaS to hit an annual run rate of $100 billion in 2019’s second quarter, after vendors earned more than $23 billion in the first quarter, with the market growing almost 30% a year (Synergy Research Group, 2019).
SaaS Revenue Forecasts Then and Now
Gartner’s successive forecasts put SaaS spending far higher in 2024 and 2025 than its 2019 outlook did.
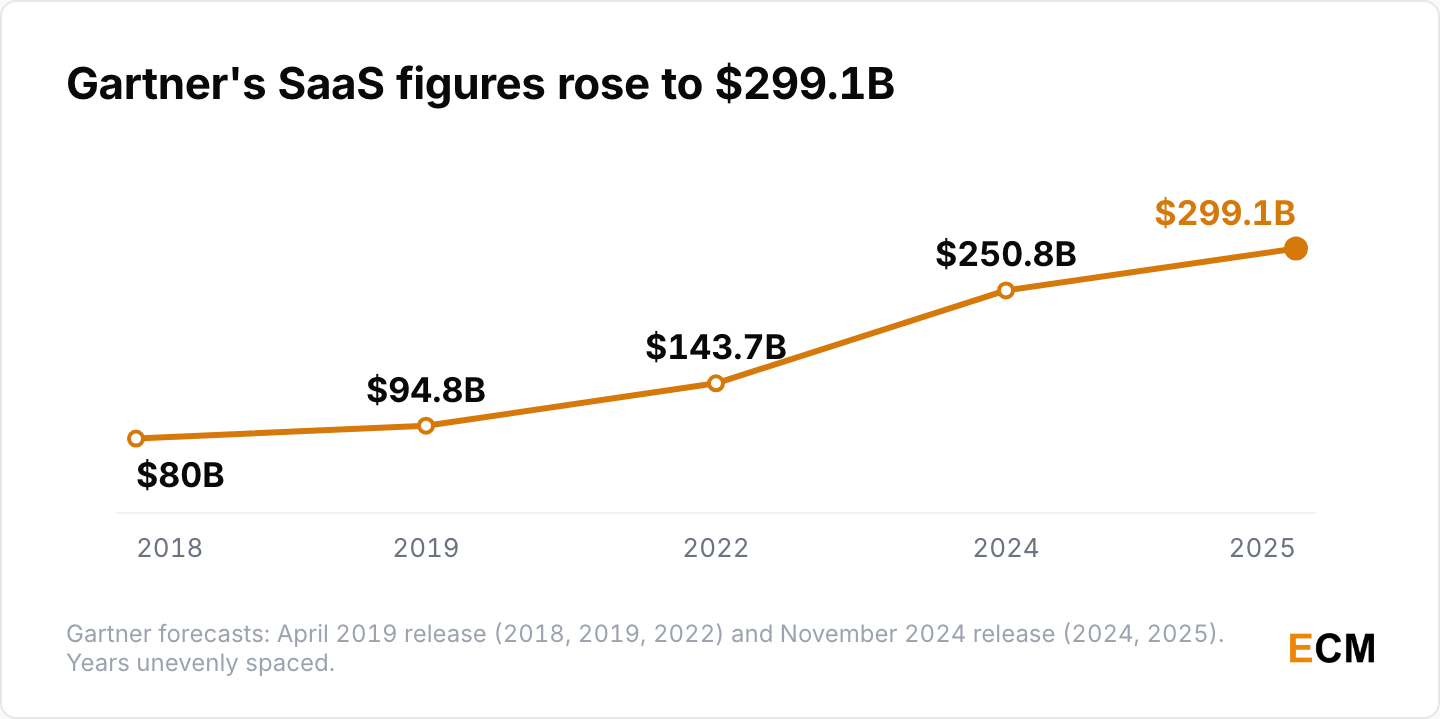
- In April 2019, Gartner put SaaS revenue at $80.0 billion for 2018 and $94.8 billion for 2019 and forecast $143.7 billion for 2022 (Gartner, 2019 public cloud forecast, 2019). Its November 2024 forecast had SaaS at $250.8 billion for 2024 (Gartner, 2024).
- Gartner also forecast in 2018 that 28% of spending in key enterprise IT segments would shift to the cloud by 2022, up from 19% in 2018 (Gartner, 2018). In April 2019, Gartner said more than a third of organizations saw cloud investments as a top three investing priority (Gartner, 2019 public cloud forecast, 2019).
Is SaaS Growing or Dying?
SaaS is growing, just slower. Private-company surveys put 2025 median growth at 20% to 22%, and public SaaS companies expect 13% over the next twelve months.
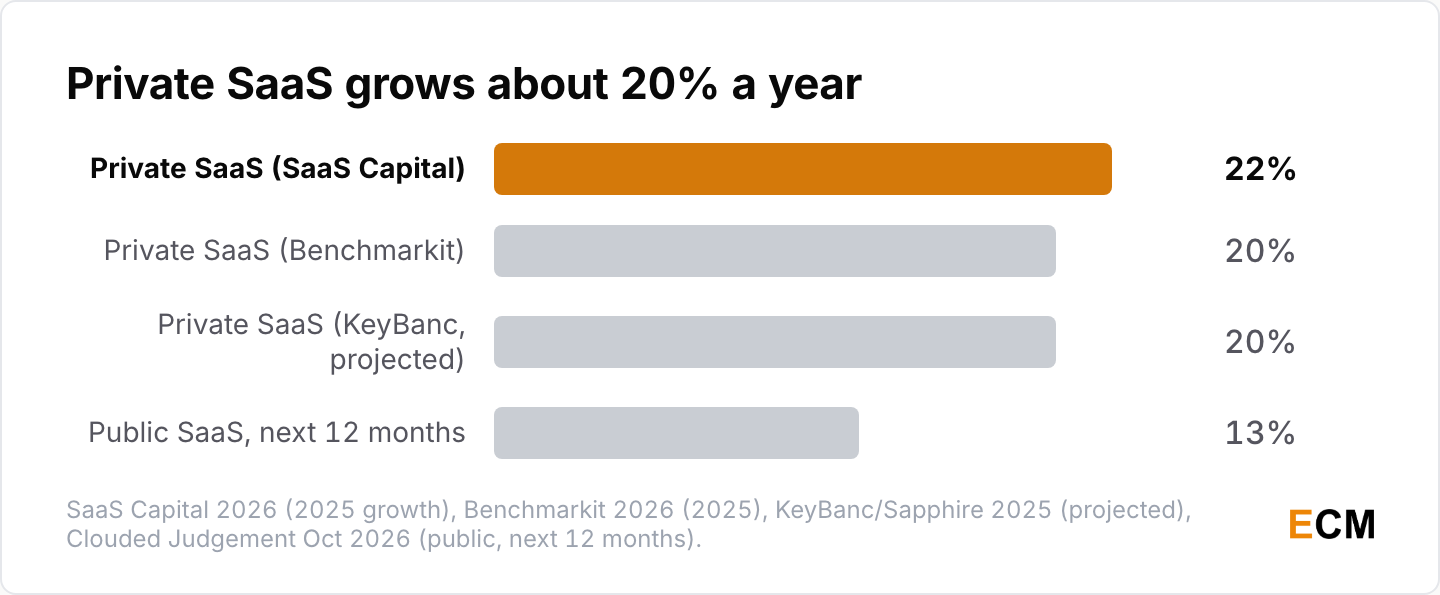
- The median private B2B SaaS company grew 22% in 2025, down from 25% in 2024; bootstrapped companies grew 20% and equity-backed companies 25% (SaaS Capital, 2026 growth benchmarks, 2026). Only 7.3% of private SaaS companies reported flat or negative growth in 2025, against a 13% peak in 2020 (SaaS Capital, 2026 growth benchmarks, 2026).
- Benchmarkit’s 2026 benchmarks put median B2B SaaS growth at 20% in 2025, as the median company cut R&D from 35% to 27% of revenue (Aleph and Benchmarkit, Rule of 40, 2026). KeyBanc and Sapphire Ventures projected private SaaS ARR growth to rise from 15% in 2024 to 20% in 2025, the first rebound in three years (KeyBanc Capital Markets and Sapphire Ventures, 2025 SaaS Survey, 2025). That is a projection from a different sample than SaaS Capital’s, so the two trends aren’t directly comparable.
- Public SaaS companies have a median forecast growth rate of 13% for the next twelve months (Clouded Judgement, October 23 2026, 2026).
SaaS Valuations and Revenue Multiples
The median public SaaS multiple rose from 2.9x in June to 4.8x in October 2026. My investment statistics cover the wider market.
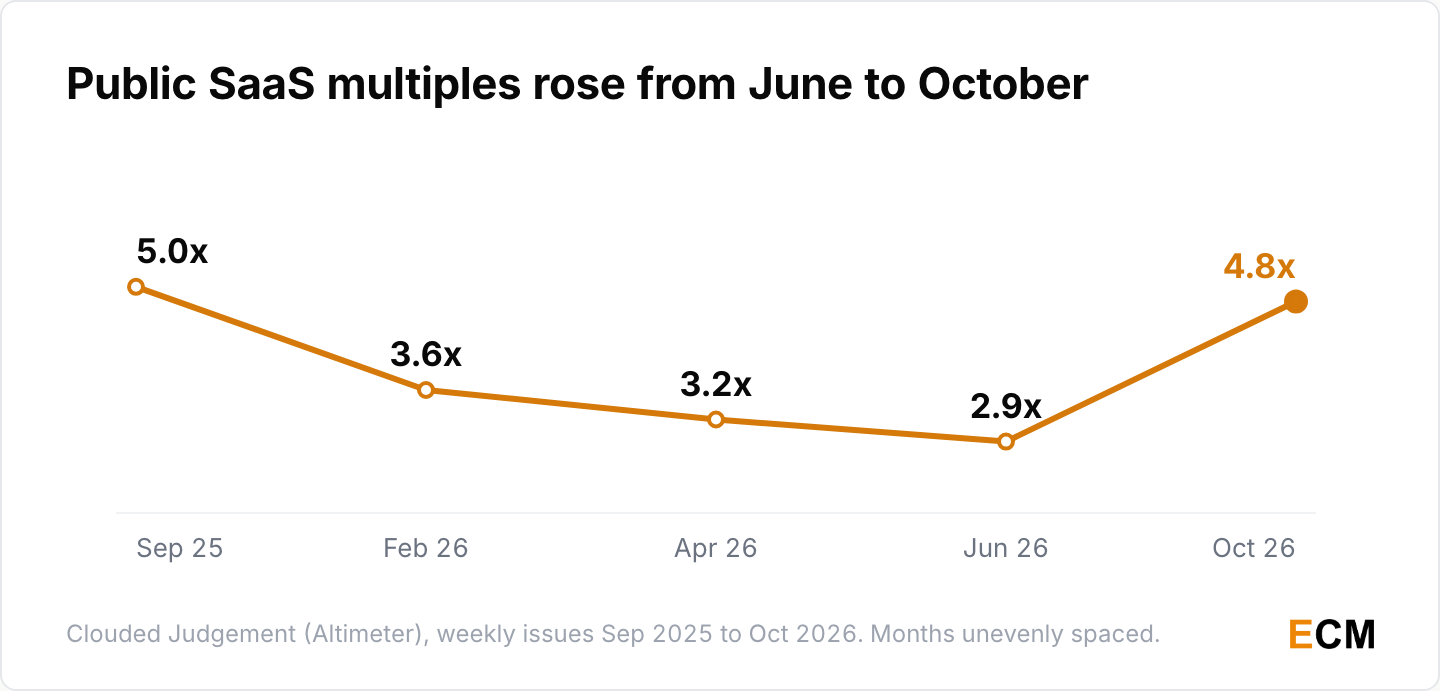
- The median public SaaS company traded at 4.8x next-twelve-month revenue on October 23, 2026, while the high-growth bucket traded at 21.0x (Clouded Judgement, October 23 2026, 2026).
- The median multiple was 5.0x in September 2025 (Clouded Judgement, 2025), 3.6x in February 2026 (Clouded Judgement, 2026), 3.2x in April 2026 (Clouded Judgement, 2026) and 2.9x on June 19, 2026 (Clouded Judgement, 2026).
- The 2025 Cloud 100, Forbes and Bessemer’s list of top private cloud companies, is worth more than $1.1 trillion, up 36% from the year before (Bessemer Venture Partners, Cloud 100 Benchmarks, 2025). The Cloud 100’s average revenue multiple fell to 20x in 2025 from 23x in 2024 and 26x in 2023; AI companies averaged 24x against 19x for the rest (Bessemer Venture Partners, Cloud 100 Benchmarks, 2025).
SaaS Spend and SaaS Application Statistics
App counts barely moved in 2025, but SaaS bills kept climbing, and most of that money sits outside IT.
How Many SaaS Apps Does the Average Company Use?
App counts have flattened in the hundreds, while the number of products to choose from keeps multiplying.
- The average company manages 305 SaaS applications, and app counts fell 0.07% year over year (Zylo, SaaS statistics, 2026). In a separate BetterCloud survey, organizations deploy an average of 27 AI-powered SaaS applications, about 22% of their stack (BetterCloud, 2026 State of SaaS, 2026).
- In 2018, the typical 200-to-501-person company used 123 apps with about 2,700 app-to-person connections, and the average employee used at least 8 apps (Blissfully, 2019 Annual SaaS Trends, 2019).
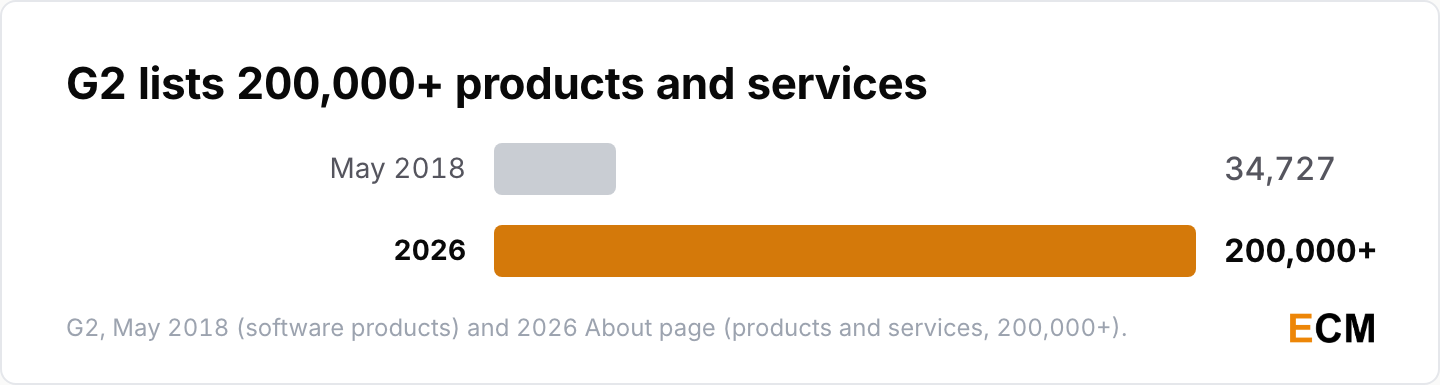
- G2 listed 34,727 software products in May 2018 (G2, SaaS industry saturation, 2018). It now lists more than 200,000 products and services across 2,000+ categories (G2, About, 2026).
- In 2016, SaaS companies faced about 9 competitors on average, up from about 1 five years earlier, in Price Intelligently’s survey of 289 SaaS companies (Price Intelligently, Lessons from 3,000 SaaS companies, 2016).
How Much Do Companies Spend on SaaS?
Blissfully reported $343,000 in average SaaS spend for 2018; Zylo reports $55.7 million for a much larger set of companies, so treat the two as separate snapshots.
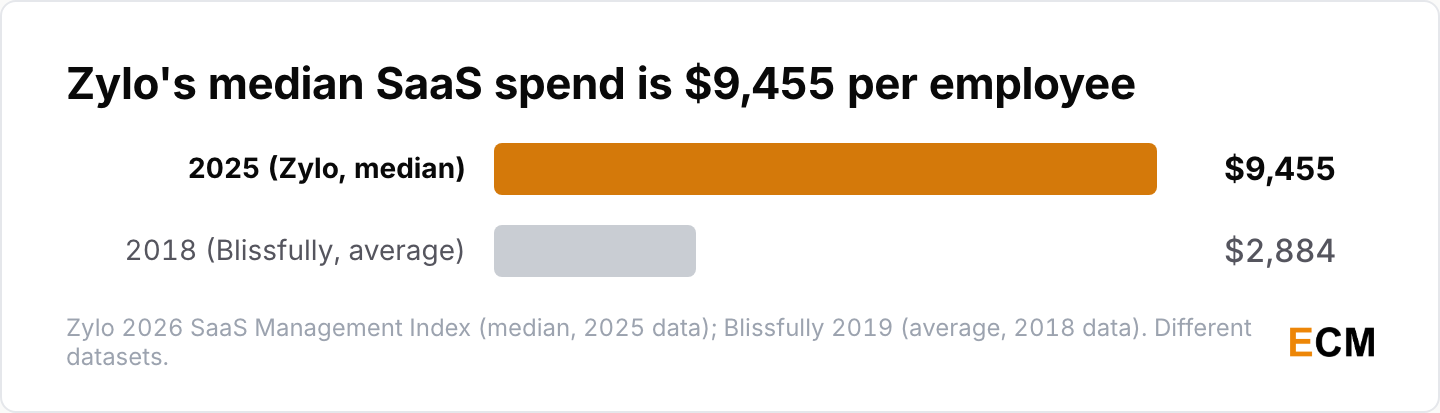
- Organizations spend an average of $55.7 million a year on SaaS (median $20.6 million), and total SaaS spend rose 8% year over year (Zylo, SaaS statistics, 2026). Median SaaS spend per employee is $9,455 (Zylo, 2026 SaaS Management Index, 2026).
- In 2018, the average company spent $343,000 on SaaS, up 78% from the previous year, or $2,884 per employee (Blissfully, 2019 Annual SaaS Trends, 2019).
- AI-native app spend rose 108% year over year, and 393% in organizations with more than 10,000 employees (Zylo, 2026 SaaS Management Index, 2026).
SaaS License Waste and Who Controls Spend
Business units control most SaaS spend, and a large share of licenses go unused.
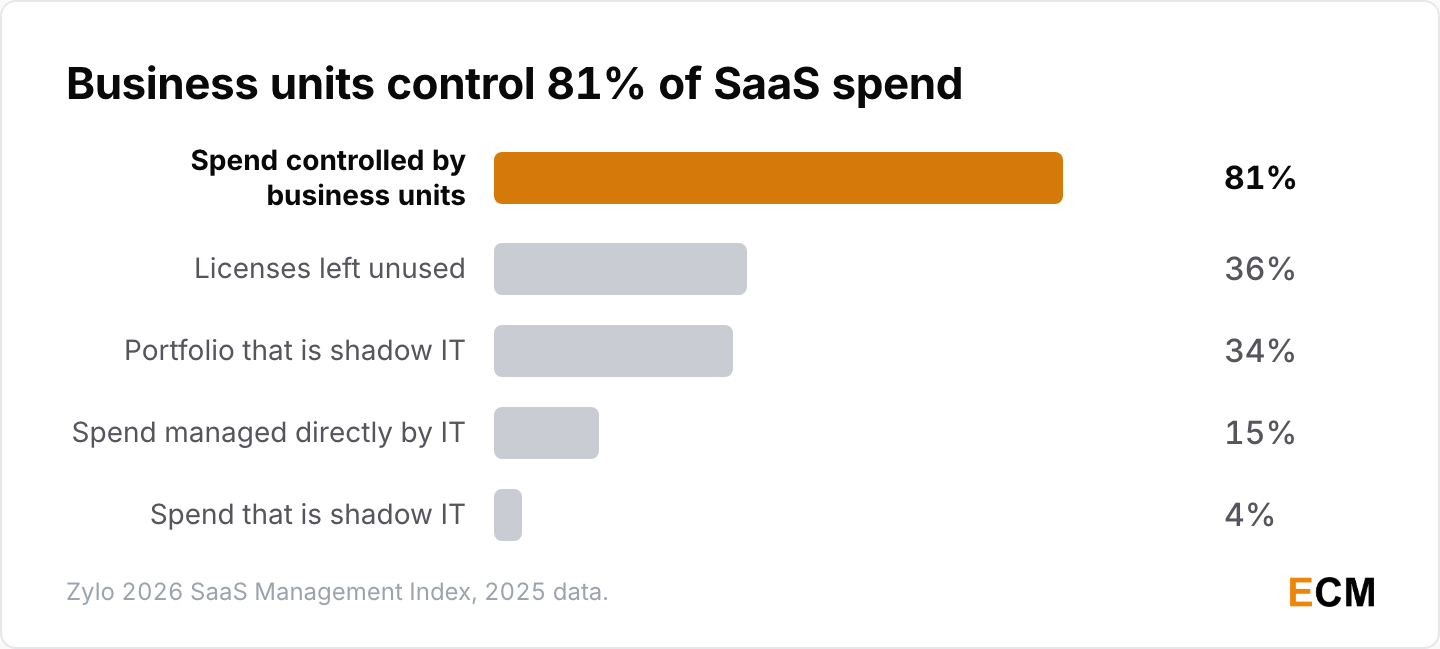
- Business units control 81% of SaaS spend, while IT directly manages 15% (Zylo, 2026 SaaS Management Index, 2026). Shadow IT accounts for 4% of SaaS spend but 34% of the SaaS portfolio (Zylo, What is shadow IT, 2026).
- Organizations leave an average of 36% of their SaaS licenses unused, measured against recommended utilization levels (Zylo, 2026 SaaS Management Index, 2026). Expense-based SaaS spend rose 267% year over year, and ChatGPT is now the most expensed app (Zylo, 2026 SaaS Management Index, 2026).
- In 2018, the average mid-sized company had 32 billing owners for its SaaS apps and changed 39% of its SaaS apps between 2017 and 2018 (Blissfully, 2019 Annual SaaS Trends, 2019). Then, 71% of companies had at least one SaaS subscription with no billing owner, and each orphaned subscription cost an average of $710 a month, or $8,520 a year (Blissfully, 2019 Annual SaaS Trends, 2019).
SaaS Churn Rate and Retention Benchmarks
Retention benchmarks vary by sample, but companies with higher net revenue retention grow faster.
What Is the Average SaaS Churn Rate?
Private SaaS companies keep roughly 84% to 91% of their revenue each year before expansion, which puts annual revenue loss at about 9% to 16%.
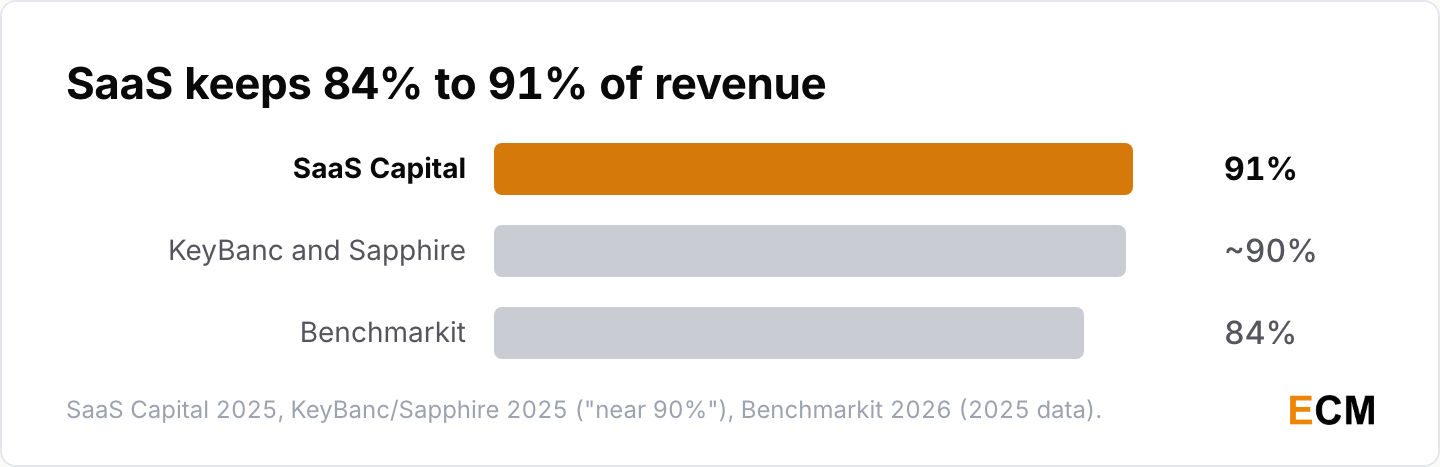
- Median gross revenue retention for private B2B SaaS is 91%, which implies about 9% of revenue lost each year before expansion (SaaS Capital, 2025 retention benchmarks, 2025). Companies with contracts above $250,000 a year keep 95% of revenue, against about 91% below that line (SaaS Capital, 2025 retention benchmarks, 2025).
- KeyBanc and Sapphire Ventures found private SaaS companies holding gross retention near 90% (KeyBanc and Sapphire Ventures, 2025 SaaS Survey, 2025). Benchmarkit puts 2025 median gross revenue retention at 84%, down 4 points year over year (Aleph and Benchmarkit, gross revenue retention, 2026).
Net Revenue Retention Benchmarks
Usage-based companies report higher median net revenue retention than seat-based companies. That’s the most useful retention finding I saw for anyone planning a SaaS business model.
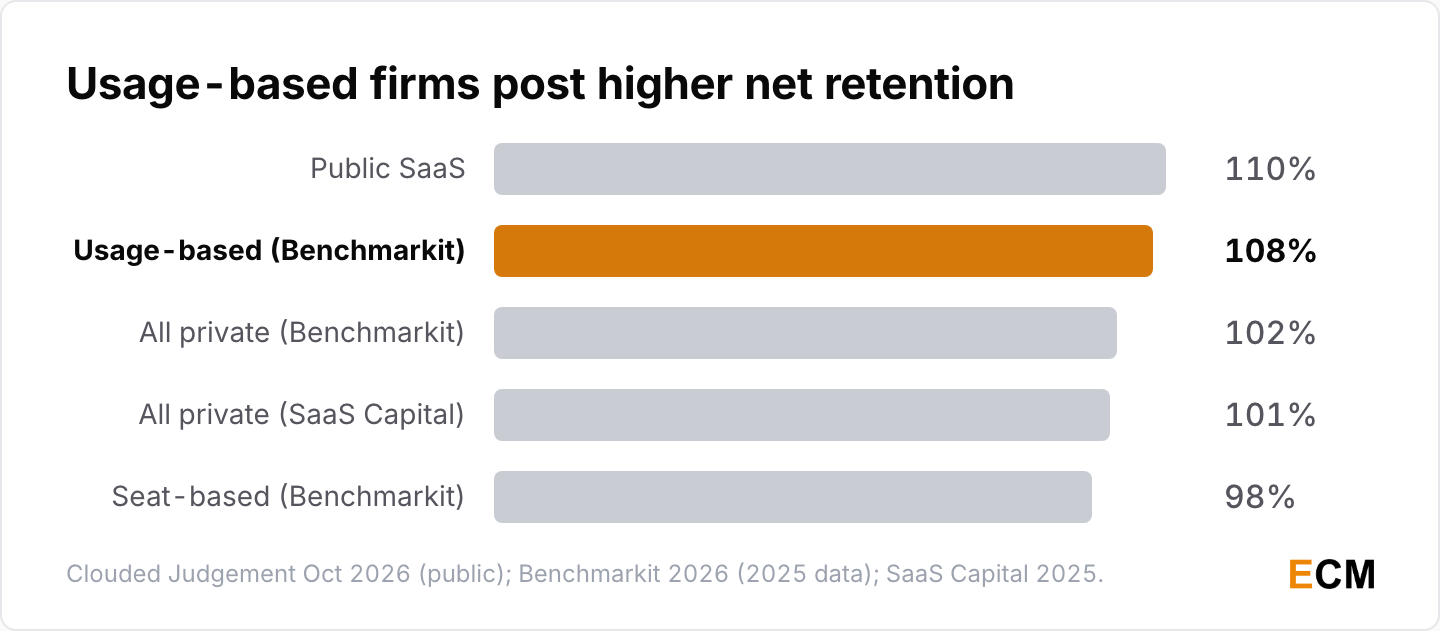
- Median net revenue retention for private SaaS companies is 101%, and 104% for bootstrapped companies (SaaS Capital, 2025 retention benchmarks, 2025). SaaS companies with the highest net retention report median growth 173% higher than the population median (SaaS Capital, 2026 growth benchmarks, 2026).
- Benchmarkit’s 2025 median is 102%; usage-based companies post 108% while seat-based companies sit at 98% (Aleph and Benchmarkit, net revenue retention, 2026). Public SaaS companies have a median net retention of 110% (Clouded Judgement, October 23 2026, 2026).
Top SaaS Metrics: Margins, CAC Payback and Spend
Gross margin, payback and spend mix are the metrics I’d check first after growth and retention.
- The median SaaS company runs an 80% gross margin on software revenue and 76% on total revenue (Aleph and Benchmarkit, gross margin, 2026). KeyBanc’s 2019 survey found a 73% median total gross margin on 2018 data (KeyBanc Capital Markets, 2019 SaaS Survey, 2019).
- Median CAC payback for private SaaS is 16 months, down from 18 in 2024 (Aleph and Benchmarkit, CAC payback, 2026). Public SaaS companies sit at 31 months (Clouded Judgement, October 23 2026, 2026).
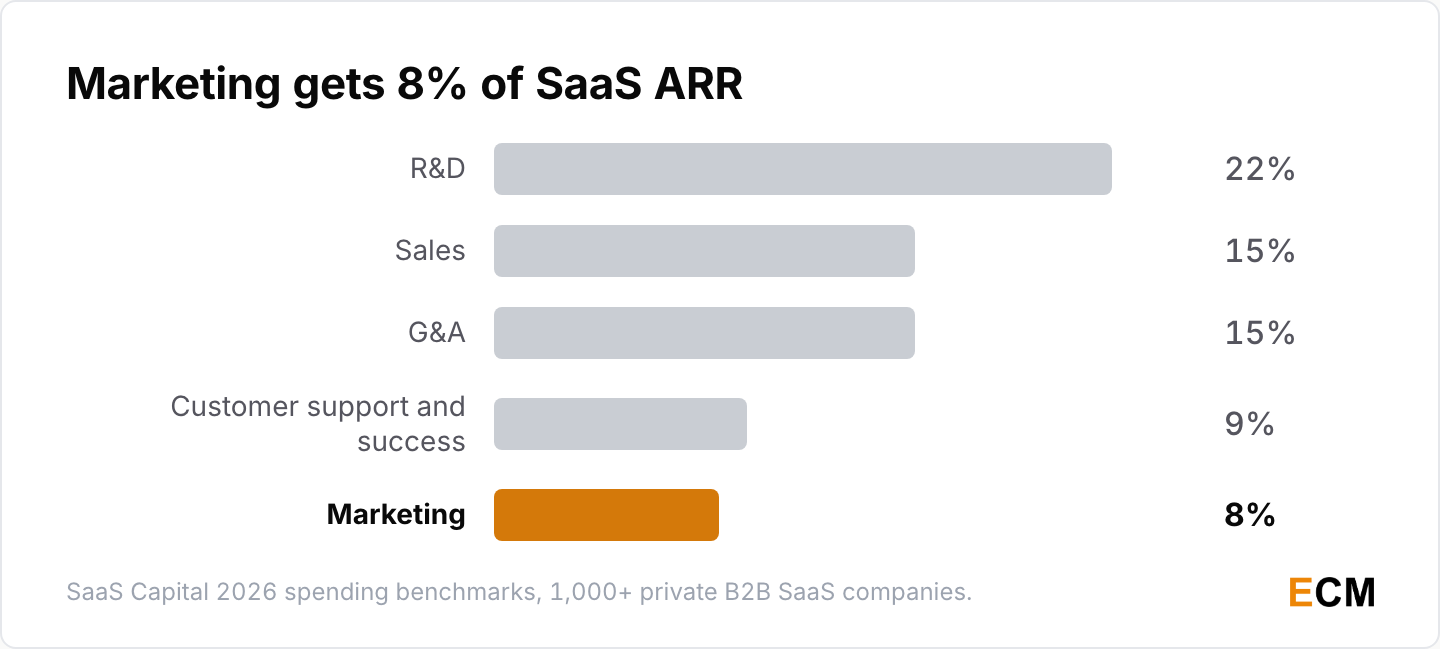
- The median private SaaS company spends 8% of ARR on marketing, 15% on sales, 22% on R&D, 15% on G&A and 9% on customer support and success (SaaS Capital, 2026 spending benchmarks, 2026).
- 83% of bootstrapped SaaS companies are profitable or within two points of breakeven, against 52% of equity-backed companies (SaaS Capital, 2026 spending benchmarks, 2026).
SaaS Growth Rules: Rule of 40 and T2D3
Two rules of thumb come up whenever founders and investors talk SaaS growth: the Rule of 40 combines growth and profit, and T2D3 describes an ambitious ARR growth path.
What Is the Rule of 40 in SaaS?
The Rule of 40 says growth rate plus profit margin should reach 40%. The median private SaaS company scores 25%, well short.
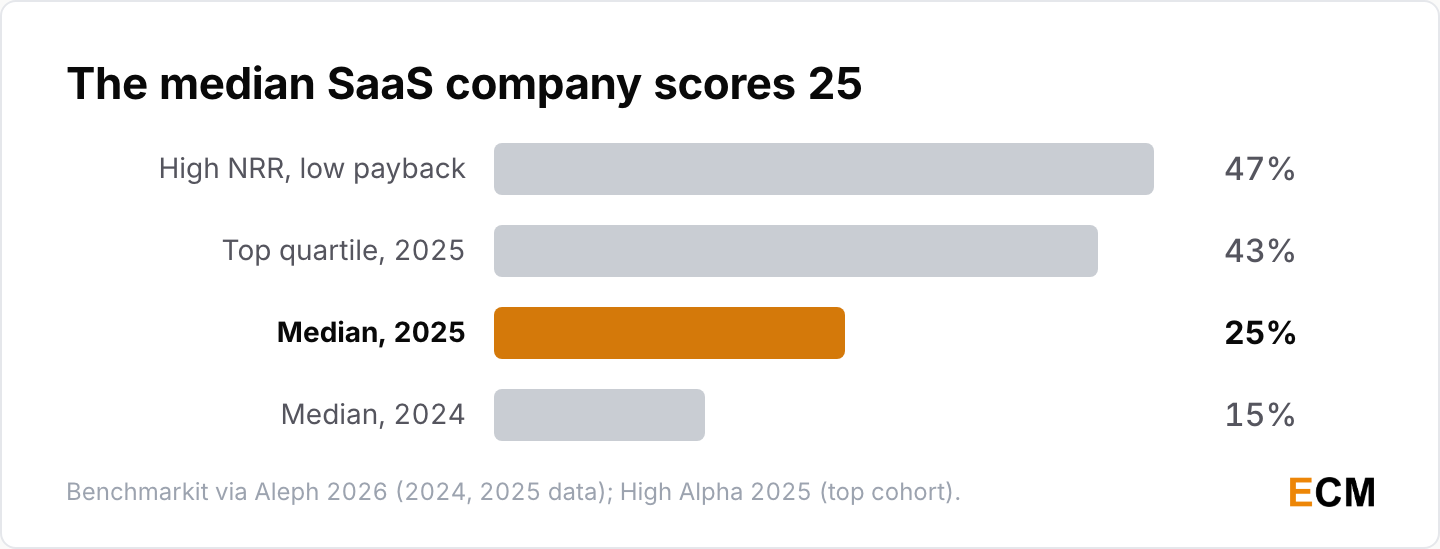
- The median private SaaS Rule of 40 score was 25% in 2025, up 10 points from 15% in 2024; the top quartile clears 43% (Aleph and Benchmarkit, Rule of 40, 2026).
- Companies with high net retention and low CAC payback averaged 71% growth and a 47% Rule of 40 score (High Alpha and Growth Unhinged, 2025 SaaS Benchmarks, 2025).
- ICONIQ found the Rule of 40 has become the most reliable predictor of public market valuation multiples, and puts net dollar retention at about 110% to 120% (ICONIQ Growth, State of Software 2025, 2025).
What Is the 3-3-2-2-2 Rule of SaaS?
The 3-3-2-2-2 rule, also called T2D3, comes from Battery Ventures’ Neeraj Agrawal: triple annual revenue twice, then double it three times.
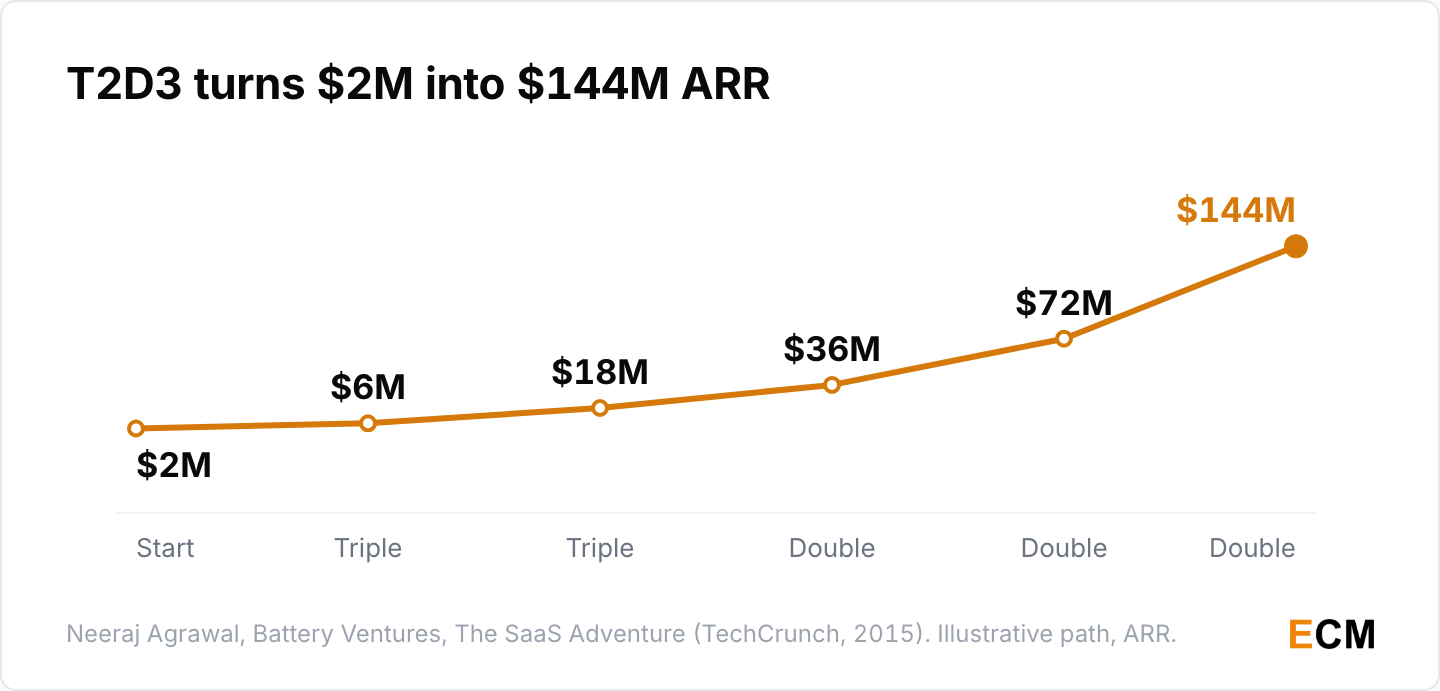
- T2D3 starts at $2 million in ARR and runs to $6 million, $18 million, $36 million, $72 million and $144 million (Neeraj Agrawal, The SaaS Adventure, 2015).
- Battery later described the path as seven stages to $100 million in annualized revenue, and said average revenue at a SaaS IPO rose from $133 million in 2015 to $328 million in 2019 (Battery Ventures, T2D3 update, 2019).
- Cloud 100 companies took an average of 7.5 years to reach $100 million in ARR, and AI companies 5.7 years (Bessemer Venture Partners, Cloud 100 Benchmarks, 2025).
The Road From Founding to SaaS IPO
2018 was the year SaaS went public, and the high-growth companies in that class took a median of 14 years to get there. My startup statistics cover the earlier stages.
- Sixteen SaaS companies went public in 2018, over a third of the 40-plus tech IPOs that year (SaaS Mag, 2018: The Year SaaS Went Public, 2019). The 2018 class of high-growth SaaS IPOs took a median of 14 years to go from founding to their IPO year (Alex Clayton, 2018 Review: High Growth SaaS IPOs, 2019).
- Salesforce, which helped kick off SaaS growth, closed fiscal 2019 with $13.28 billion in revenue and a $3.60 billion fourth quarter, equal to $14.4 billion a year if that quarter is annualized (Salesforce, Q4 FY19 results, 2019).
AI in SaaS Statistics for 2026
The figures below cover AI-company growth, revenue and pricing, plus how AI workflow automation shows up in SaaS budgets.
How AI Is Changing SaaS Growth
AI-native SaaS companies grew faster than other SaaS companies in every ARR band High Alpha measured.
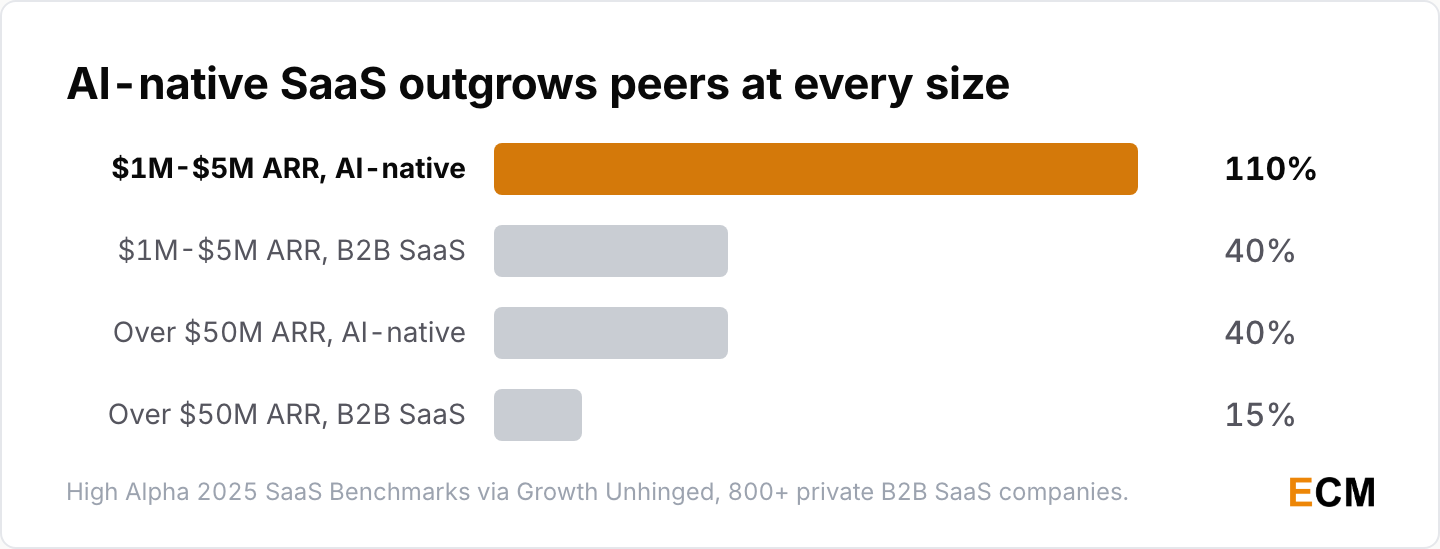
- Median growth for AI-native companies was 110% at $1 million to $5 million ARR against 40% for B2B SaaS companies of the same size, and 40% against 15% above $50 million ARR (High Alpha and Growth Unhinged, 2025 SaaS Benchmarks, 2025).
- Among High Alpha’s respondents, every company founded in 2025 reported AI as core to its product, against none of those founded in 2016 (High Alpha, 2025 SaaS Benchmarks, 2025).
- AI-native companies convert more free trials and proofs of concept; among companies above $100 million ARR, conversion averaged 56% against 32% for others (ICONIQ Growth, State of Go-to-Market 2025, 2025). Across ICONIQ’s 2026 sample, free-trial and proof-of-concept conversion rose to roughly 50%, from about 36% in 2025 (ICONIQ Growth, State of Go-to-Market 2026, 2026). In 2018, OpenView found free trials were the most popular product-led growth strategy (OpenView, 2018 Expansion SaaS Benchmarks, 2018).
Biggest SaaS Companies by Revenue
Microsoft reports Cloud revenue and Copilot paid seats, and Salesforce reports Agentforce ARR alongside total revenue.
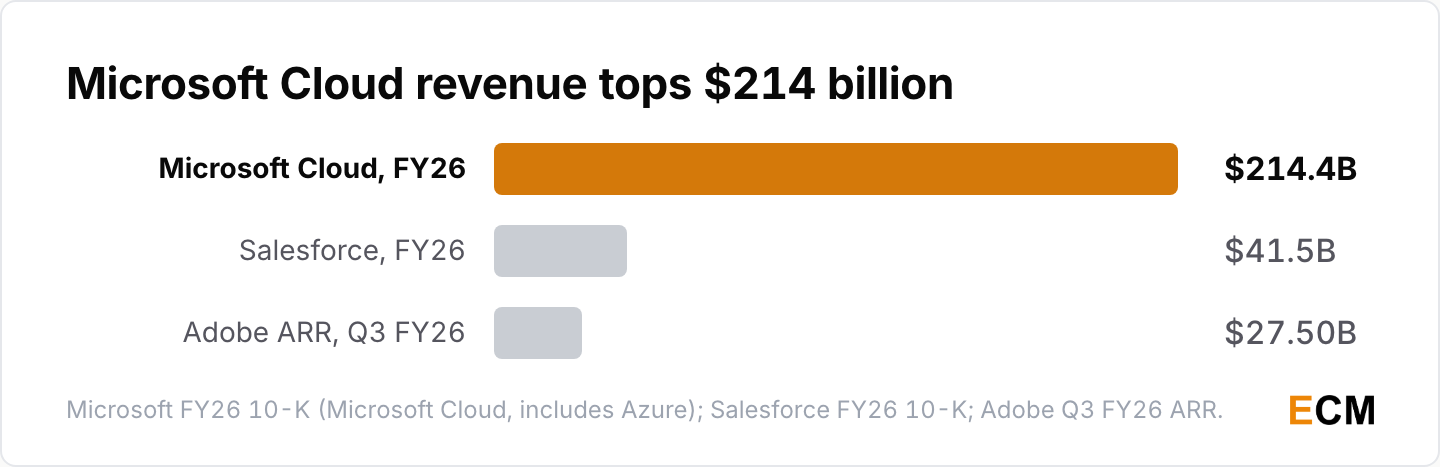
- Microsoft Cloud revenue rose 27% to $214.4 billion in fiscal 2026 (Microsoft, FY26 10-K, 2026). Microsoft 365 Copilot passed 30 million paid seats (Microsoft, FY26 Q4 results, 2026).
- Salesforce revenue was $41.5 billion in fiscal 2026, up 10% (Salesforce, FY26 10-K, 2026). Agentforce ARR passed $1.5 billion in Q2 fiscal 2027 (Salesforce, Q2 FY27 results, 2026).
- Adobe exited its third fiscal quarter of 2026 with $27.50 billion in annualized recurring revenue (Adobe, Q3 FY26 results, 2026). ServiceNow’s subscription revenue was $3.88 billion in Q2 2026, up 24.5% (ServiceNow, Q2 2026 results, 2026).
- In 2019, Microsoft led enterprise SaaS with a 17% worldwide share (Synergy Research Group, 2019).
The Fastest-Growing AI Software Companies
AI companies report revenue in different ways, from monthly revenue to run rates and ARR, and the numbers are climbing fast.
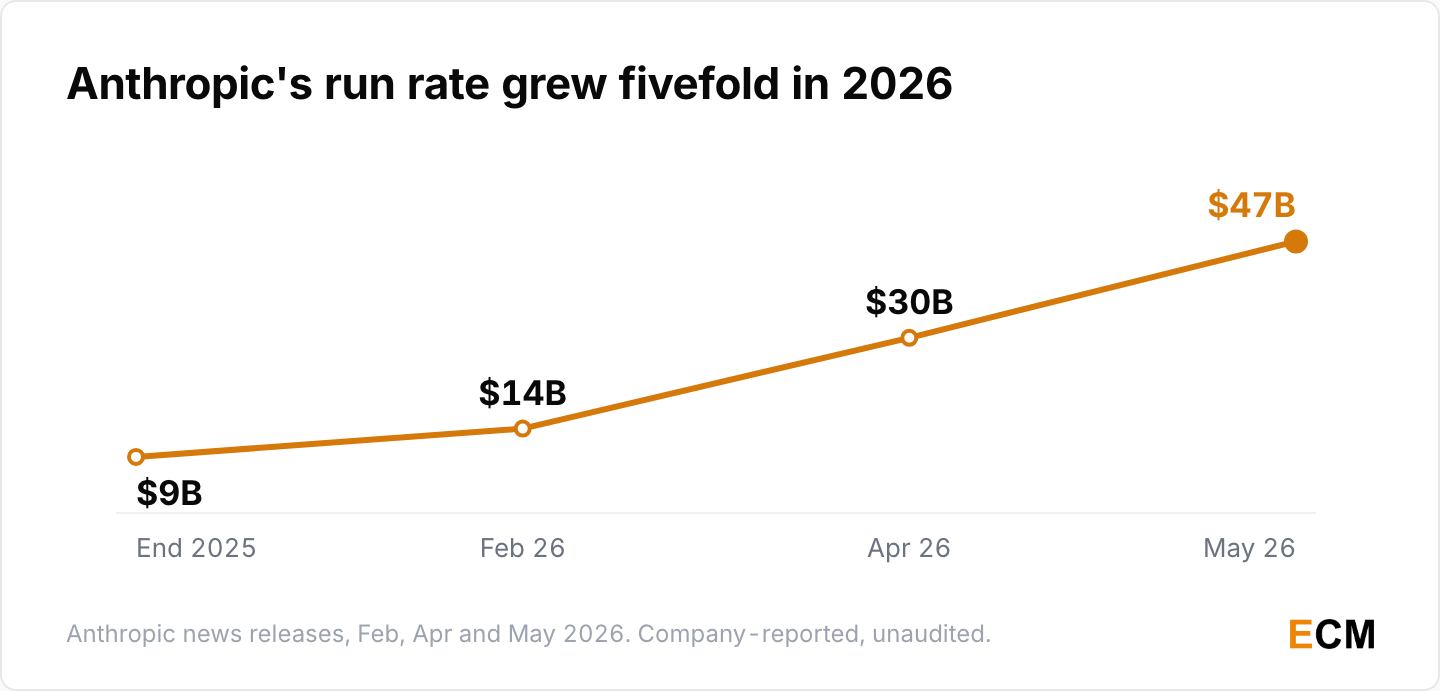
- Anthropic’s run-rate revenue crossed $47 billion in May 2026 (Anthropic, Series H, 2026), up from about $9 billion at the end of 2025 and more than $30 billion in April 2026 (Anthropic, compute expansion, 2026). It was $14 billion in February 2026 (Anthropic, Series G, 2026).
- OpenAI said in March 2026 it was generating $2 billion in revenue a month (OpenAI, Accelerating the next phase of AI, 2026), and ChatGPT now has more than 1 billion weekly active users (OpenAI, ChatGPT Ads, 2026).
- Databricks passed a $7 billion revenue run rate in Q2 2026, growing more than 80% year over year (Databricks, 2026). Glean reached $300 million in ARR 15 months after reaching $100 million (Glean, 2026), and Cursor crossed $1 billion in annualized revenue in November 2025 (Cursor, Series D, 2025).
SaaS Pricing Models Shift to Usage
SaaS vendors now sell on seats, usage and outcomes, and buyers report surprise charges from consumption and AI pricing.
- In a January 2025 survey of 100 SaaS companies, 85% had adopted usage-based pricing (Metronome, 2025 State of Usage-Based Pricing, 2025). Hybrid subscription-plus-usage models report the highest median growth at 21%, and 44% of SaaS companies charge for AI features (Maxio, 2025 Pricing Trends Report, 2025).
- Microsoft 365 Copilot costs $30 per user per month on an annual plan (Microsoft, Copilot enterprise, 2026). Salesforce charges $0.10 per Agentforce action (Salesforce, Flex Credits, 2025), and Intercom’s Fin charges $0.99 per outcome (Fin, pricing, 2026).
- 78% of IT leaders reported unexpected charges from consumption-based or AI pricing in the past year, and 61% had to cut projects because of unplanned SaaS costs (Zylo, 2026 SaaS Management Index, 2026).
SaaS Marketing, Buying and Security Statistics
Buyer surveys track how chatbots, review sites and sales reps shape software purchases, which is the part content marketers can influence.
How B2B Buyers Choose SaaS Tools
In G2’s survey, 51% of buyers begin software research with an AI chatbot more often than with Google. More in my B2B buyer statistics.
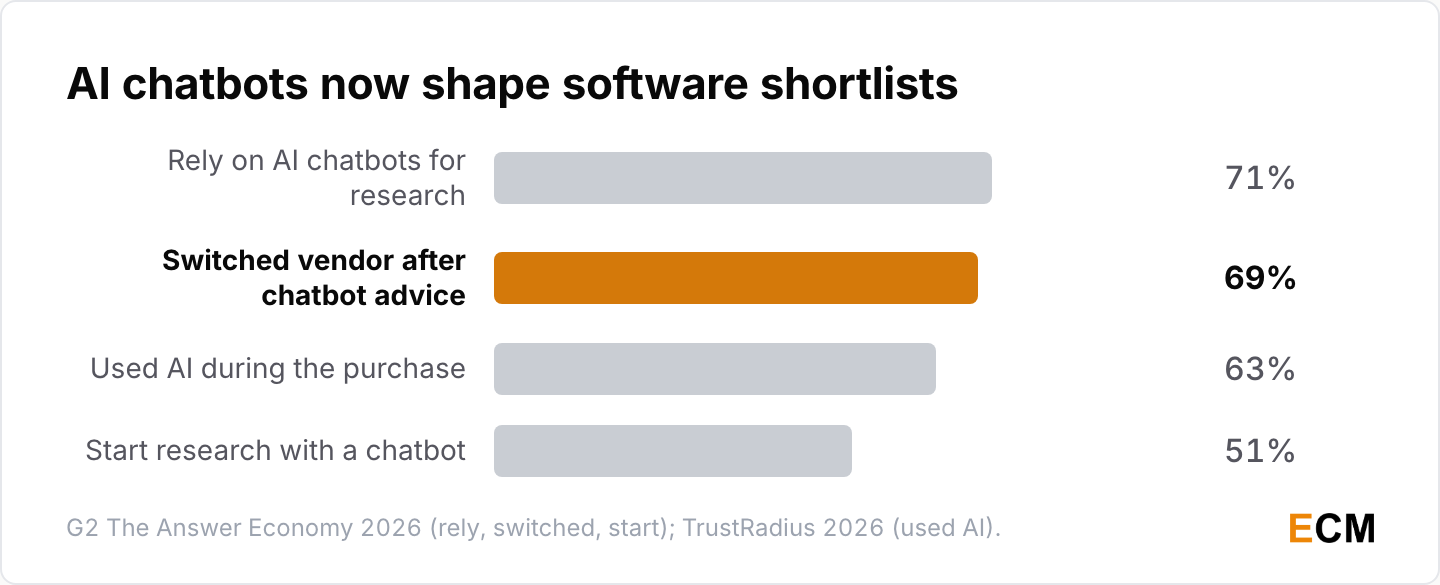
- 71% of B2B software buyers rely on AI chatbots for software research, and 69% picked a different vendor than planned because of chatbot guidance (G2, The Answer Economy, 2026).
- Evaluation is now the longest stage of the software buying journey, ahead of research for the first time, and IT security review is the biggest delay after vendor selection, cited by 39% of buyers and 50% of enterprise buyers (G2, 2026 Buyer Behavior Report, 2026).
- 67% of B2B buyers prefer a sales-rep-free experience, yet 69% turn to reps to validate AI-generated insights (Gartner, B2B buyer survey, 2026). And 63% of technology buyers used AI during their purchase journey (TrustRadius, 2026 B2B Buying Disconnect, 2026).
- CEB research reported in Harvard Business Review found that, on average, 5.4 people must formally sign off on each B2B purchase, based on surveys of more than 5,000 stakeholders (Harvard Business Review, Making the Consensus Sale, 2015).
SaaS Content Marketing Statistics
Private SaaS companies spend a median 8% of ARR on marketing (SaaS Capital, 2026). The studies below cover AI adoption by marketers and SaaS content marketing traffic. For SaaS-specific tactics, see my SaaS marketing guide, and my digital marketing statistics cover search traffic more broadly.
- 45% of B2B marketers plan to increase investment in AI-powered marketing tools in 2026, the most-cited area (Content Marketing Institute, B2B trends for 2026, 2025). A year earlier, 81% of B2B marketers said their teams use generative AI tools, up from 72% the year before (Content Marketing Institute, Outlook for 2025, 2024).
- In a 2019 study of the Montclare SaaS 250, the biggest SaaS companies, the top 10% of blogs received 104,000 organic search visits a month, yet 38 of those companies had no blog (Emily Byford, State of SaaS Content Marketing, 2019).
- In 2016, most of 1,647 SaaS companies surveyed by Price Intelligently had fewer than ten customer development conversations a month (Price Intelligently, Lessons from 3,000 SaaS companies, 2016).
SaaS Security Statistics
Security teams feel confident about SaaS, and most of them had a SaaS incident anyway.
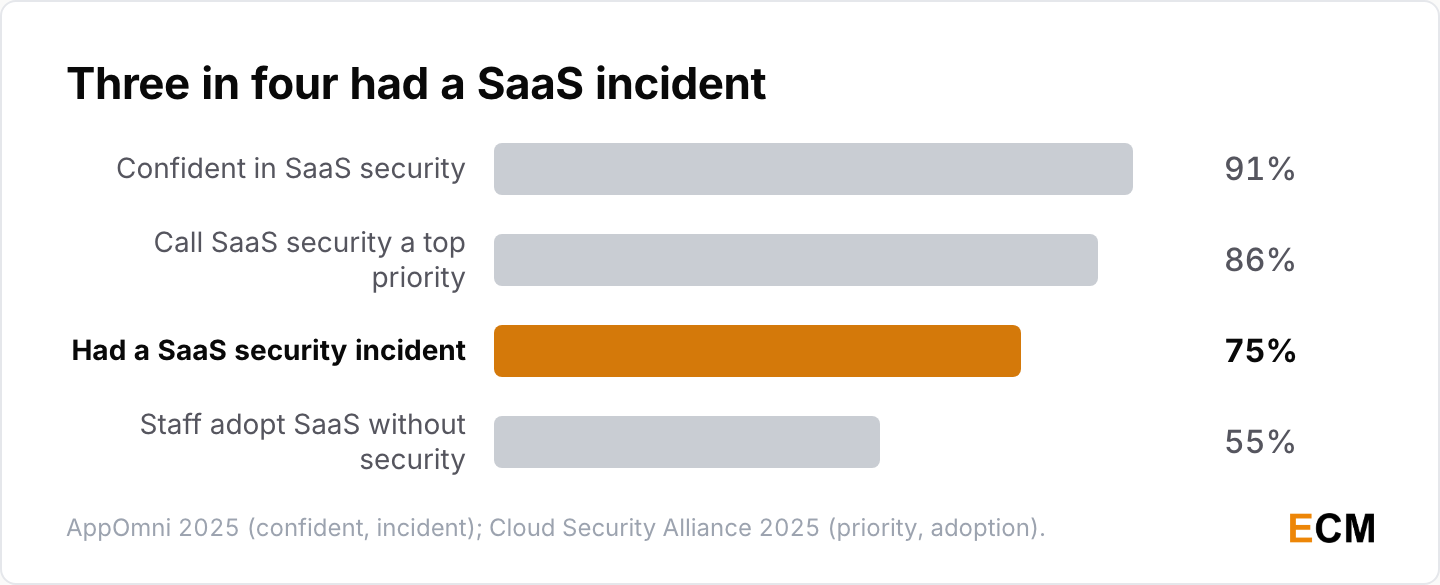
- 75% of organizations had a SaaS-related security incident in the past year, up 33% from 2024, even though 91% felt confident in their SaaS security (AppOmni, State of SaaS Security 2025, 2025).
- SaaS security is a top priority for 86% of organizations, and 55% say employees adopt SaaS tools without security involvement (Cloud Security Alliance, State of SaaS Security, 2025). Breaches involving a third party reached 48% of all breaches in Verizon’s 2026 dataset, up 60% from the year before (Verizon, 2026 DBIR executive summary, 2026).
- In a 2018 survey of 301 US IT and security professionals at companies with 5,000 or more employees, 27% said their organizations had experienced a breach of customer identity data stored in a public cloud, on-premises or in a SaaS provider’s cloud (Ping Identity, 2019).
- LinkedIn’s March 2018 analysis put turnover in its Technology (software) category at 13.2%, the highest of any industry it listed (LinkedIn Talent Blog, 2018).
Frequently Asked Questions
How big is the SaaS market in 2026?
Statista projects worldwide SaaS revenue of $488.5 billion in 2026, growing to $855.6 billion by 2031 (Statista Market Insights, 2026). Gartner’s end-user spending forecast had SaaS at $299.1 billion in 2025 (Gartner, 2024). The two come from different providers and years, so pick one and cite it by name.
Is SaaS growing or dying?
Growing, at a slower pace. Median private B2B SaaS growth was 22% in 2025, down from 25% in 2024 (SaaS Capital, 2026), and public SaaS companies expect 13% median growth over the next year (Clouded Judgement, 2026). AI-native companies are growing far faster.
How many SaaS apps does the average company use?
The average company manages 305 SaaS applications, and that count was flat in 2025 (Zylo, 2026). It leaves 36% of SaaS licenses unused (Zylo, 2026 SaaS Management Index, 2026).
What is the average SaaS churn rate?
Private B2B SaaS companies keep a median 91% of revenue each year before expansion, which implies annual revenue churn of about 9% (SaaS Capital, 2025). Benchmarkit’s median gross retention is lower at 84% (Aleph and Benchmarkit, 2026).
What is the Rule of 40 in SaaS?
The Rule of 40 says a SaaS company’s growth rate plus profit margin should total at least 40%. The median private SaaS company scored 25% in 2025, and the top quartile cleared 43% (Aleph and Benchmarkit, 2026).
What is the 3-3-2-2-2 rule of SaaS?
It’s T2D3: triple ARR for two years, then double it for three, taking a company from $2 million to $144 million in ARR (Neeraj Agrawal, The SaaS Adventure, 2015).
What are the top SaaS metrics?
Growth rate, net revenue retention, gross revenue retention, gross margin, CAC payback and the Rule of 40. B2B SaaS medians: 22% growth (SaaS Capital, 2026), 102% net retention (Benchmarkit, 2026), 80% software gross margin (Benchmarkit, 2026) and 16-month CAC payback (Benchmarkit, 2026).
Written by
Editorial Staff
The Editorial Staff represents the writers, editors, and content creators who have worked (or work) at Elite Content Marketer. The experimenter-in-chief behind the team is Chintan Zalani, who has close to a decade of experience trying to make sense of the content marketing industry. Started in 2019, Elite Content Marketer is on a mission to help creators build sustainable businesses.
Related Articles

Marketing Data
EdTech Market Statistics 2026: 60 Funding and AI Facts
60 edtech market statistics for 2026: market size, venture funding, Duolingo and Coursera results, school device use, AI adoption and cybersecurity data.
Nov 3, 2026Read more →
Marketing Data
Branding Statistics 2026: 60 Facts You Need to Know
60 branding statistics for 2026: brand value rankings, trust and authenticity, user-generated content, social media, loyalty and B2B branding data.
Nov 2, 2026Read more →

Marketing Data
Web Hosting Statistics 2026: 60 Facts on Market Size
60 web hosting statistics for 2026: a $150.2B market, Shopify and Hostinger lead site share, AWS holds 26% of cloud, and WordPress runs 39.5% of sites.
Oct 30, 2026Read more →